Immigrants from Cameroon vs Immigrants from Colombia 12th Grade, No Diploma
COMPARE
Immigrants from Cameroon
Immigrants from Colombia
12th Grade, No Diploma
12th Grade, No Diploma Comparison
Immigrants from Cameroon
Immigrants from Colombia
90.5%
12TH GRADE, NO DIPLOMA
7.4/ 100
METRIC RATING
218th/ 347
METRIC RANK
90.1%
12TH GRADE, NO DIPLOMA
2.1/ 100
METRIC RATING
237th/ 347
METRIC RANK
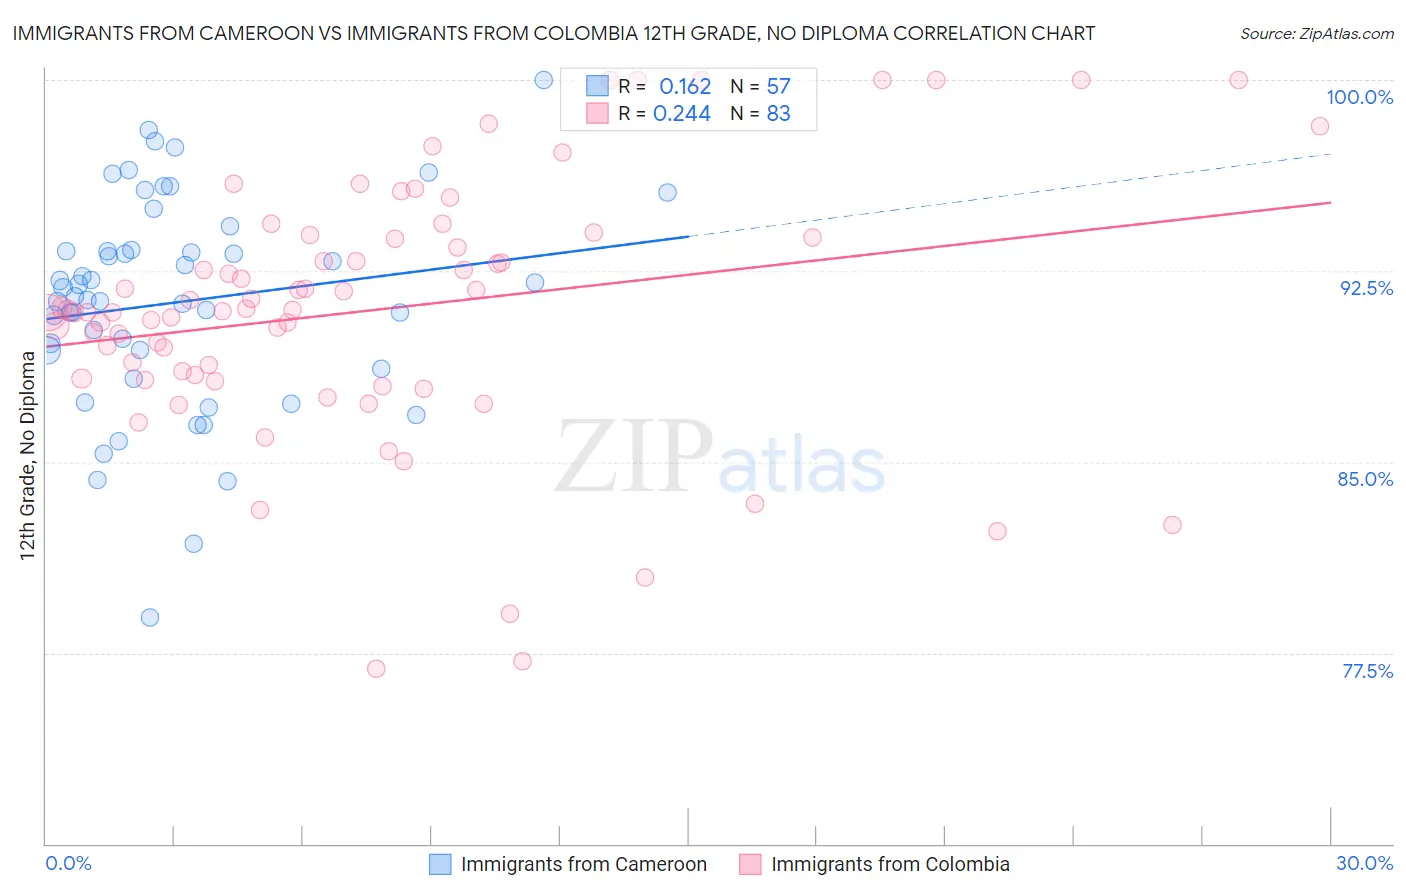
Immigrants from Cameroon vs Immigrants from Colombia 12th Grade, No Diploma Correlation Chart
The statistical analysis conducted on geographies consisting of 130,618,704 people shows a poor positive correlation between the proportion of Immigrants from Cameroon and percentage of population with at least 12th grade (no diploma) education in the United States with a correlation coefficient (R) of 0.162 and weighted average of 90.5%. Similarly, the statistical analysis conducted on geographies consisting of 378,643,826 people shows a weak positive correlation between the proportion of Immigrants from Colombia and percentage of population with at least 12th grade (no diploma) education in the United States with a correlation coefficient (R) of 0.244 and weighted average of 90.1%, a difference of 0.42%.
12th Grade, No Diploma Correlation Summary
| Measurement | Immigrants from Cameroon | Immigrants from Colombia |
| Minimum | 78.9% | 76.9% |
| Maximum | 100.0% | 100.0% |
| Range | 21.1% | 23.1% |
| Mean | 91.3% | 91.0% |
| Median | 91.5% | 90.9% |
| Interquartile 25% (IQ1) | 89.0% | 88.3% |
| Interquartile 75% (IQ3) | 93.3% | 93.8% |
| Interquartile Range (IQR) | 4.3% | 5.5% |
| Standard Deviation (Sample) | 4.2% | 5.1% |
| Standard Deviation (Population) | 4.1% | 5.0% |
Demographics Similar to Immigrants from Cameroon and Immigrants from Colombia by 12th Grade, No Diploma
In terms of 12th grade, no diploma, the demographic groups most similar to Immigrants from Cameroon are Cherokee (90.5%, a difference of 0.0%), Uruguayan (90.4%, a difference of 0.020%), Colombian (90.4%, a difference of 0.040%), Immigrants from Liberia (90.4%, a difference of 0.090%), and Immigrants from Somalia (90.4%, a difference of 0.11%). Similarly, the demographic groups most similar to Immigrants from Colombia are Immigrants from Thailand (90.1%, a difference of 0.030%), Immigrants from South America (90.1%, a difference of 0.030%), Colville (90.1%, a difference of 0.030%), Immigrants from Uzbekistan (90.1%, a difference of 0.030%), and Blackfeet (90.1%, a difference of 0.050%).
| Demographics | Rating | Rank | 12th Grade, No Diploma |
| Cherokee | 7.4 /100 | #217 | Tragic 90.5% |
| Immigrants | Cameroon | 7.4 /100 | #218 | Tragic 90.5% |
| Uruguayans | 7.0 /100 | #219 | Tragic 90.4% |
| Colombians | 6.6 /100 | #220 | Tragic 90.4% |
| Immigrants | Liberia | 5.7 /100 | #221 | Tragic 90.4% |
| Immigrants | Somalia | 5.3 /100 | #222 | Tragic 90.4% |
| South Americans | 5.0 /100 | #223 | Tragic 90.3% |
| Immigrants | Panama | 4.8 /100 | #224 | Tragic 90.3% |
| Chickasaw | 4.8 /100 | #225 | Tragic 90.3% |
| Immigrants | Zaire | 4.6 /100 | #226 | Tragic 90.3% |
| Nigerians | 4.5 /100 | #227 | Tragic 90.3% |
| Creek | 3.9 /100 | #228 | Tragic 90.3% |
| Immigrants | Bahamas | 3.6 /100 | #229 | Tragic 90.2% |
| Immigrants | Philippines | 2.8 /100 | #230 | Tragic 90.2% |
| Peruvians | 2.7 /100 | #231 | Tragic 90.2% |
| Blackfeet | 2.4 /100 | #232 | Tragic 90.1% |
| Immigrants | Thailand | 2.3 /100 | #233 | Tragic 90.1% |
| Immigrants | South America | 2.3 /100 | #234 | Tragic 90.1% |
| Colville | 2.3 /100 | #235 | Tragic 90.1% |
| Immigrants | Uzbekistan | 2.2 /100 | #236 | Tragic 90.1% |
| Immigrants | Colombia | 2.1 /100 | #237 | Tragic 90.1% |