Immigrants from Cameroon vs Burmese 2nd Grade
COMPARE
Immigrants from Cameroon
Burmese
2nd Grade
2nd Grade Comparison
Immigrants from Cameroon
Burmese
97.4%
2ND GRADE
0.2/ 100
METRIC RATING
271st/ 347
METRIC RANK
98.0%
2ND GRADE
81.0/ 100
METRIC RATING
142nd/ 347
METRIC RANK
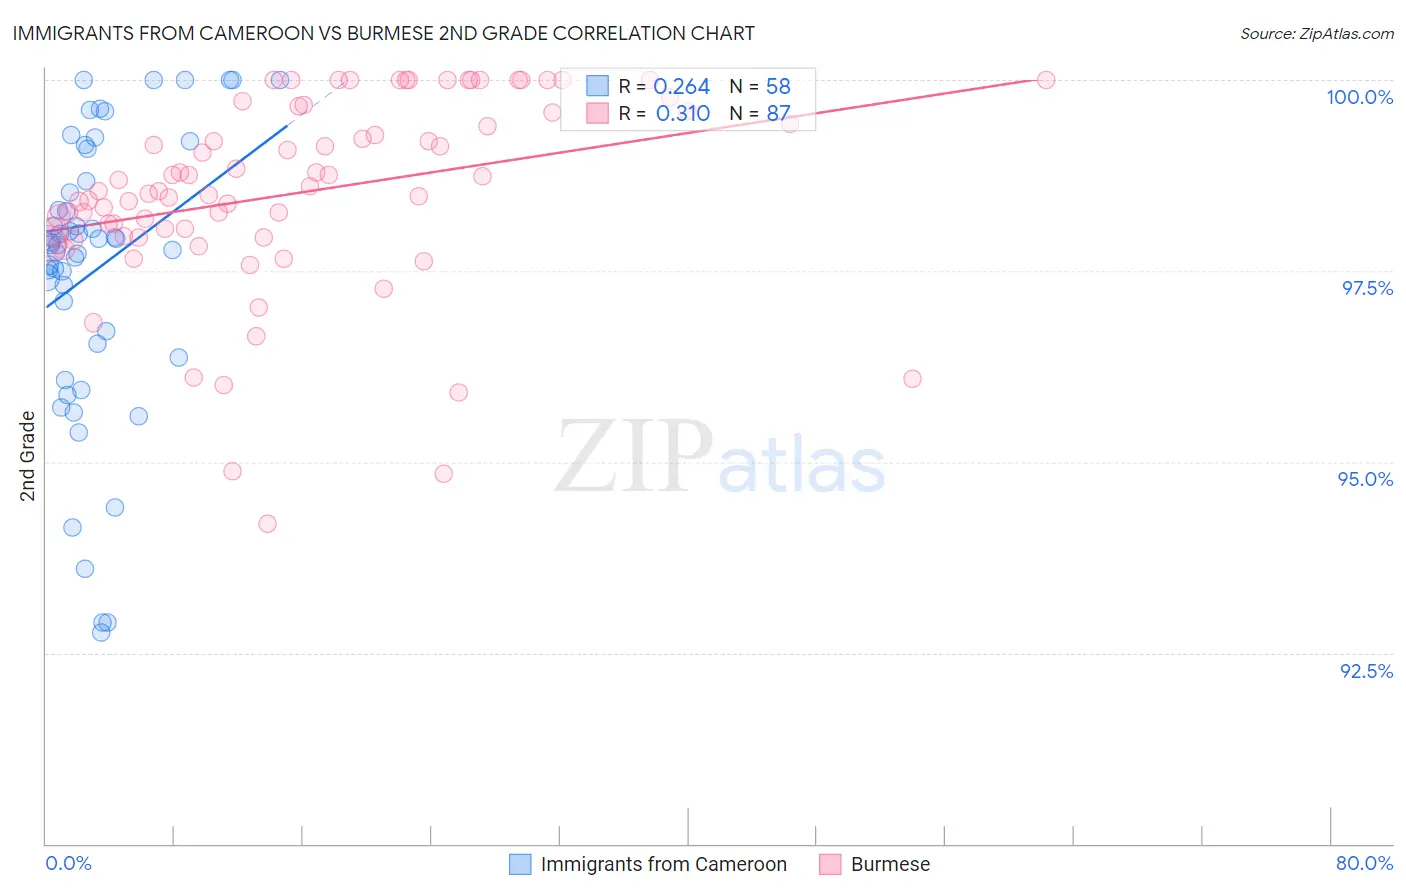
Immigrants from Cameroon vs Burmese 2nd Grade Correlation Chart
The statistical analysis conducted on geographies consisting of 130,752,798 people shows a weak positive correlation between the proportion of Immigrants from Cameroon and percentage of population with at least 2nd grade education in the United States with a correlation coefficient (R) of 0.264 and weighted average of 97.4%. Similarly, the statistical analysis conducted on geographies consisting of 465,408,311 people shows a mild positive correlation between the proportion of Burmese and percentage of population with at least 2nd grade education in the United States with a correlation coefficient (R) of 0.310 and weighted average of 98.0%, a difference of 0.62%.
2nd Grade Correlation Summary
| Measurement | Immigrants from Cameroon | Burmese |
| Minimum | 92.8% | 94.2% |
| Maximum | 100.0% | 100.0% |
| Range | 7.2% | 5.8% |
| Mean | 97.5% | 98.5% |
| Median | 97.9% | 98.5% |
| Interquartile 25% (IQ1) | 96.6% | 98.0% |
| Interquartile 75% (IQ3) | 98.7% | 99.6% |
| Interquartile Range (IQR) | 2.1% | 1.6% |
| Standard Deviation (Sample) | 1.9% | 1.3% |
| Standard Deviation (Population) | 1.8% | 1.3% |
Similar Demographics by 2nd Grade
Demographics Similar to Immigrants from Cameroon by 2nd Grade
In terms of 2nd grade, the demographic groups most similar to Immigrants from Cameroon are Immigrants from Peru (97.4%, a difference of 0.010%), Immigrants from Jamaica (97.4%, a difference of 0.020%), Immigrants from Bolivia (97.4%, a difference of 0.020%), Ghanaian (97.4%, a difference of 0.020%), and Immigrants from China (97.3%, a difference of 0.030%).
| Demographics | Rating | Rank | 2nd Grade |
| Immigrants | Liberia | 0.4 /100 | #264 | Tragic 97.4% |
| Immigrants | South America | 0.4 /100 | #265 | Tragic 97.4% |
| Immigrants | Sierra Leone | 0.4 /100 | #266 | Tragic 97.4% |
| Cubans | 0.3 /100 | #267 | Tragic 97.4% |
| Immigrants | Nigeria | 0.3 /100 | #268 | Tragic 97.4% |
| West Indians | 0.3 /100 | #269 | Tragic 97.4% |
| Immigrants | Jamaica | 0.2 /100 | #270 | Tragic 97.4% |
| Immigrants | Cameroon | 0.2 /100 | #271 | Tragic 97.4% |
| Immigrants | Peru | 0.1 /100 | #272 | Tragic 97.4% |
| Immigrants | Bolivia | 0.1 /100 | #273 | Tragic 97.4% |
| Ghanaians | 0.1 /100 | #274 | Tragic 97.4% |
| Immigrants | China | 0.1 /100 | #275 | Tragic 97.3% |
| Immigrants | Philippines | 0.1 /100 | #276 | Tragic 97.3% |
| Immigrants | Western Africa | 0.1 /100 | #277 | Tragic 97.3% |
| Immigrants | Uzbekistan | 0.1 /100 | #278 | Tragic 97.3% |
Demographics Similar to Burmese by 2nd Grade
In terms of 2nd grade, the demographic groups most similar to Burmese are Alsatian (98.0%, a difference of 0.0%), Immigrants from Turkey (98.0%, a difference of 0.010%), Hmong (98.0%, a difference of 0.010%), Filipino (98.0%, a difference of 0.010%), and Immigrants from Israel (98.0%, a difference of 0.010%).
| Demographics | Rating | Rank | 2nd Grade |
| Immigrants | Bulgaria | 89.7 /100 | #135 | Excellent 98.0% |
| Immigrants | Kuwait | 89.2 /100 | #136 | Excellent 98.0% |
| Immigrants | Romania | 88.3 /100 | #137 | Excellent 98.0% |
| Israelis | 87.9 /100 | #138 | Excellent 98.0% |
| Blackfeet | 87.5 /100 | #139 | Excellent 98.0% |
| Palestinians | 83.9 /100 | #140 | Excellent 98.0% |
| Immigrants | Turkey | 83.0 /100 | #141 | Excellent 98.0% |
| Burmese | 81.0 /100 | #142 | Excellent 98.0% |
| Alsatians | 80.5 /100 | #143 | Excellent 98.0% |
| Hmong | 80.0 /100 | #144 | Good 98.0% |
| Filipinos | 79.2 /100 | #145 | Good 98.0% |
| Immigrants | Israel | 78.0 /100 | #146 | Good 98.0% |
| Immigrants | Greece | 76.8 /100 | #147 | Good 98.0% |
| Jordanians | 74.5 /100 | #148 | Good 98.0% |
| Apache | 74.0 /100 | #149 | Good 97.9% |