Immigrants from Cabo Verde vs Immigrants from Switzerland 12th Grade, No Diploma
COMPARE
Immigrants from Cabo Verde
Immigrants from Switzerland
12th Grade, No Diploma
12th Grade, No Diploma Comparison
Immigrants from Cabo Verde
Immigrants from Switzerland
85.8%
12TH GRADE, NO DIPLOMA
0.0/ 100
METRIC RATING
324th/ 347
METRIC RANK
92.5%
12TH GRADE, NO DIPLOMA
99.2/ 100
METRIC RATING
82nd/ 347
METRIC RANK
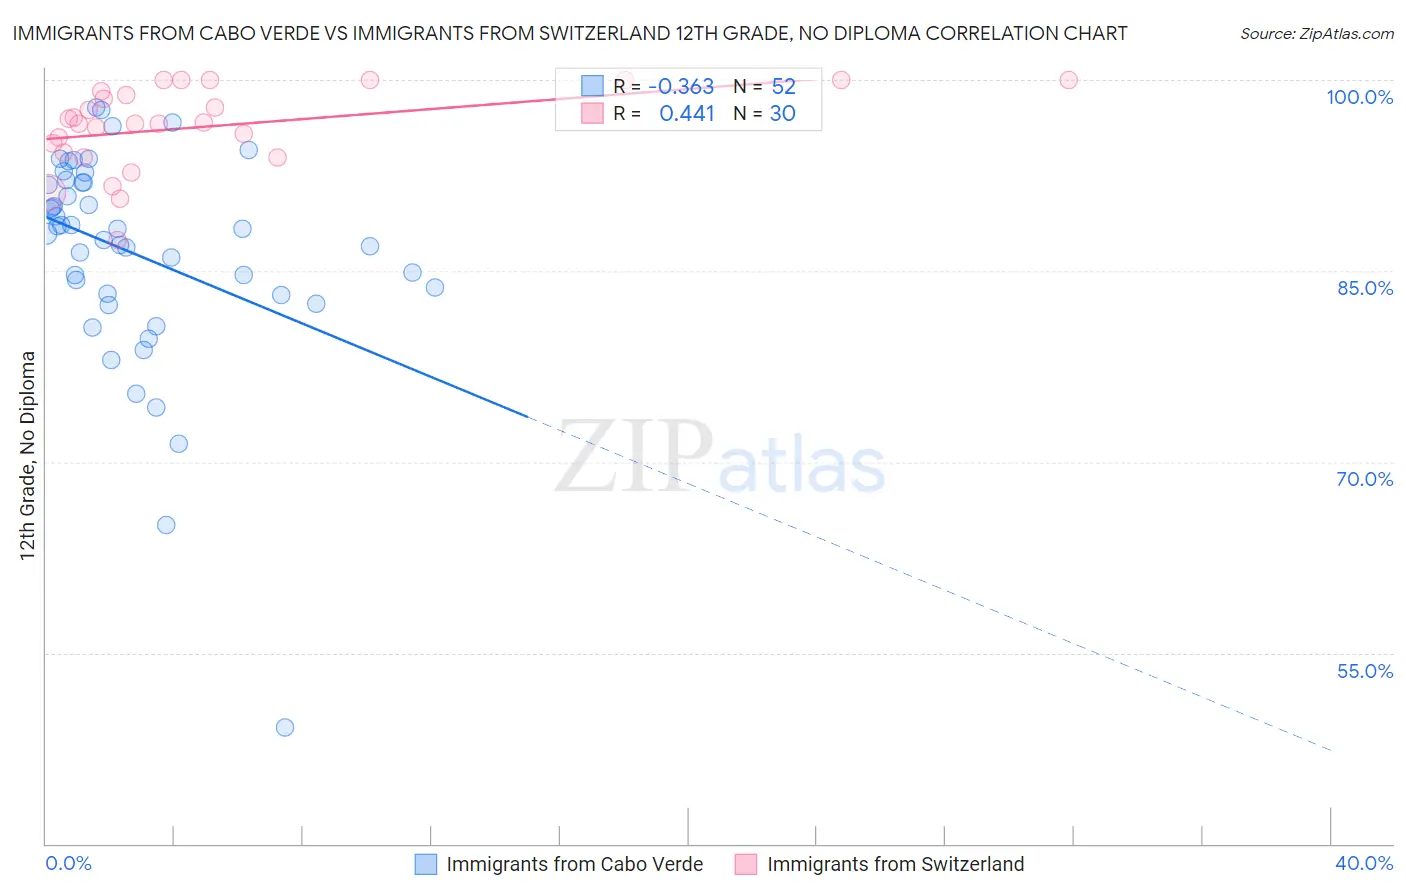
Immigrants from Cabo Verde vs Immigrants from Switzerland 12th Grade, No Diploma Correlation Chart
The statistical analysis conducted on geographies consisting of 38,158,504 people shows a mild negative correlation between the proportion of Immigrants from Cabo Verde and percentage of population with at least 12th grade (no diploma) education in the United States with a correlation coefficient (R) of -0.363 and weighted average of 85.8%. Similarly, the statistical analysis conducted on geographies consisting of 148,083,583 people shows a moderate positive correlation between the proportion of Immigrants from Switzerland and percentage of population with at least 12th grade (no diploma) education in the United States with a correlation coefficient (R) of 0.441 and weighted average of 92.5%, a difference of 7.9%.
12th Grade, No Diploma Correlation Summary
| Measurement | Immigrants from Cabo Verde | Immigrants from Switzerland |
| Minimum | 49.2% | 87.5% |
| Maximum | 97.9% | 100.0% |
| Range | 48.7% | 12.5% |
| Mean | 86.3% | 96.3% |
| Median | 88.1% | 96.6% |
| Interquartile 25% (IQ1) | 83.2% | 94.3% |
| Interquartile 75% (IQ3) | 92.0% | 99.1% |
| Interquartile Range (IQR) | 8.8% | 4.8% |
| Standard Deviation (Sample) | 8.5% | 3.3% |
| Standard Deviation (Population) | 8.4% | 3.2% |
Similar Demographics by 12th Grade, No Diploma
Demographics Similar to Immigrants from Cabo Verde by 12th Grade, No Diploma
In terms of 12th grade, no diploma, the demographic groups most similar to Immigrants from Cabo Verde are Mexican American Indian (85.7%, a difference of 0.070%), Dominican (85.7%, a difference of 0.090%), Lumbee (85.7%, a difference of 0.10%), Honduran (85.5%, a difference of 0.29%), and Hispanic or Latino (85.4%, a difference of 0.39%).
| Demographics | Rating | Rank | 12th Grade, No Diploma |
| Navajo | 0.0 /100 | #317 | Tragic 87.1% |
| Belizeans | 0.0 /100 | #318 | Tragic 87.0% |
| Immigrants | Belize | 0.0 /100 | #319 | Tragic 87.0% |
| Immigrants | Nicaragua | 0.0 /100 | #320 | Tragic 86.6% |
| Puerto Ricans | 0.0 /100 | #321 | Tragic 86.5% |
| Central American Indians | 0.0 /100 | #322 | Tragic 86.5% |
| Yuman | 0.0 /100 | #323 | Tragic 86.5% |
| Immigrants | Cabo Verde | 0.0 /100 | #324 | Tragic 85.8% |
| Mexican American Indians | 0.0 /100 | #325 | Tragic 85.7% |
| Dominicans | 0.0 /100 | #326 | Tragic 85.7% |
| Lumbee | 0.0 /100 | #327 | Tragic 85.7% |
| Hondurans | 0.0 /100 | #328 | Tragic 85.5% |
| Hispanics or Latinos | 0.0 /100 | #329 | Tragic 85.4% |
| Immigrants | Azores | 0.0 /100 | #330 | Tragic 85.3% |
| Central Americans | 0.0 /100 | #331 | Tragic 85.2% |
Demographics Similar to Immigrants from Switzerland by 12th Grade, No Diploma
In terms of 12th grade, no diploma, the demographic groups most similar to Immigrants from Switzerland are Immigrants from Denmark (92.5%, a difference of 0.0%), Immigrants from Israel (92.5%, a difference of 0.010%), French Canadian (92.6%, a difference of 0.020%), Cambodian (92.6%, a difference of 0.040%), and Romanian (92.6%, a difference of 0.040%).
| Demographics | Rating | Rank | 12th Grade, No Diploma |
| Native Hawaiians | 99.4 /100 | #75 | Exceptional 92.6% |
| French | 99.4 /100 | #76 | Exceptional 92.6% |
| Immigrants | England | 99.4 /100 | #77 | Exceptional 92.6% |
| Cambodians | 99.3 /100 | #78 | Exceptional 92.6% |
| Romanians | 99.3 /100 | #79 | Exceptional 92.6% |
| French Canadians | 99.3 /100 | #80 | Exceptional 92.6% |
| Immigrants | Denmark | 99.2 /100 | #81 | Exceptional 92.5% |
| Immigrants | Switzerland | 99.2 /100 | #82 | Exceptional 92.5% |
| Immigrants | Israel | 99.2 /100 | #83 | Exceptional 92.5% |
| Immigrants | Bulgaria | 99.1 /100 | #84 | Exceptional 92.5% |
| Immigrants | Saudi Arabia | 99.0 /100 | #85 | Exceptional 92.5% |
| Immigrants | Turkey | 98.9 /100 | #86 | Exceptional 92.4% |
| Immigrants | France | 98.8 /100 | #87 | Exceptional 92.4% |
| Scotch-Irish | 98.8 /100 | #88 | Exceptional 92.4% |
| Canadians | 98.7 /100 | #89 | Exceptional 92.4% |