Immigrants from Cabo Verde vs Alaskan Athabascan Professional Degree
COMPARE
Immigrants from Cabo Verde
Alaskan Athabascan
Professional Degree
Professional Degree Comparison
Immigrants from Cabo Verde
Alaskan Athabascans
3.1%
PROFESSIONAL DEGREE
0.0/ 100
METRIC RATING
330th/ 347
METRIC RANK
3.8%
PROFESSIONAL DEGREE
2.3/ 100
METRIC RATING
241st/ 347
METRIC RANK
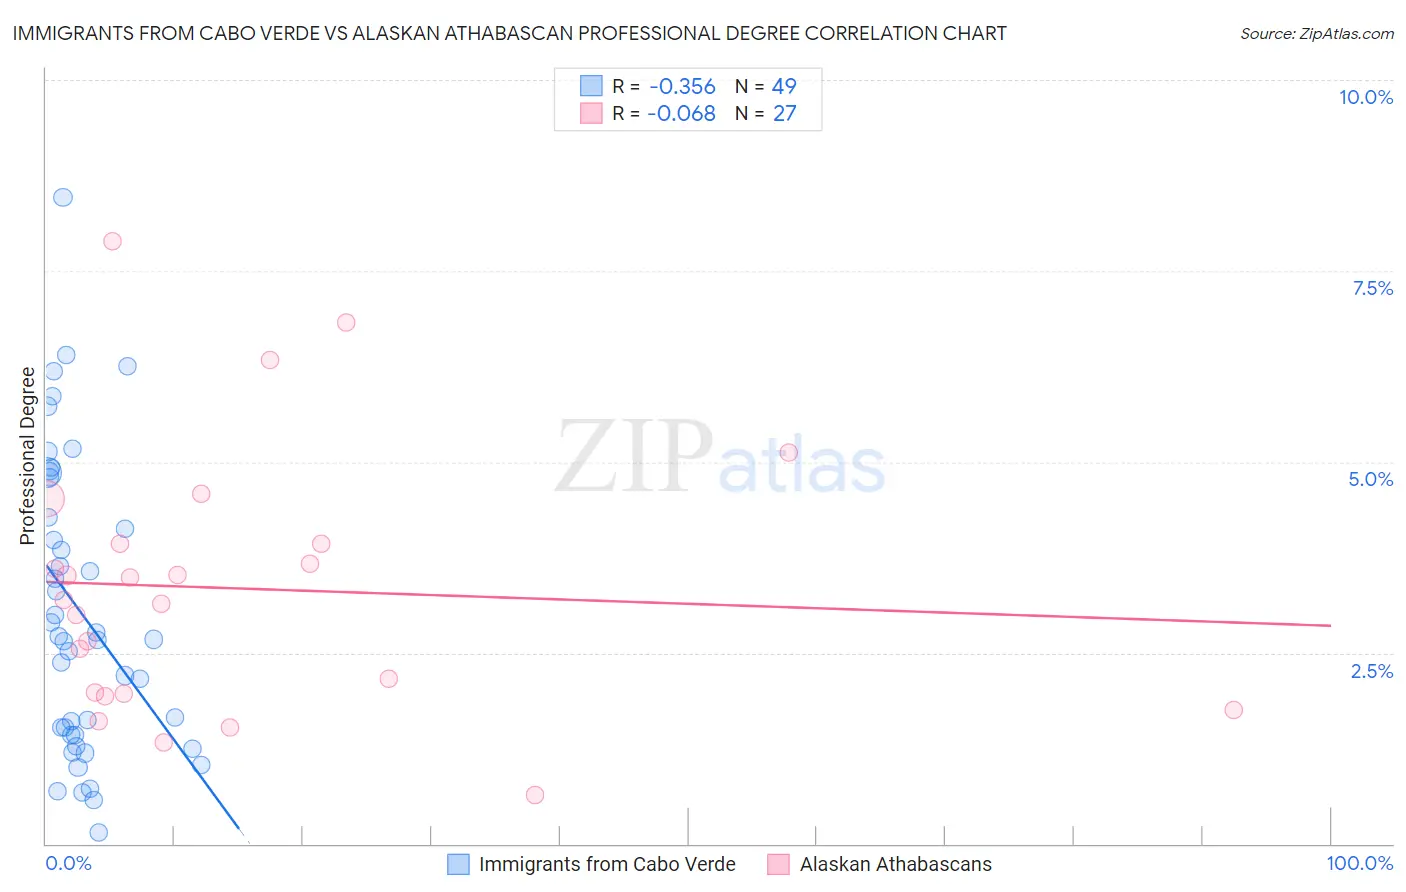
Immigrants from Cabo Verde vs Alaskan Athabascan Professional Degree Correlation Chart
The statistical analysis conducted on geographies consisting of 38,118,065 people shows a mild negative correlation between the proportion of Immigrants from Cabo Verde and percentage of population with at least professional degree education in the United States with a correlation coefficient (R) of -0.356 and weighted average of 3.1%. Similarly, the statistical analysis conducted on geographies consisting of 45,732,326 people shows a slight negative correlation between the proportion of Alaskan Athabascans and percentage of population with at least professional degree education in the United States with a correlation coefficient (R) of -0.068 and weighted average of 3.8%, a difference of 23.2%.
Professional Degree Correlation Summary
| Measurement | Immigrants from Cabo Verde | Alaskan Athabascan |
| Minimum | 0.14% | 0.64% |
| Maximum | 8.5% | 7.9% |
| Range | 8.3% | 7.2% |
| Mean | 3.0% | 3.3% |
| Median | 2.7% | 3.2% |
| Interquartile 25% (IQ1) | 1.4% | 2.0% |
| Interquartile 75% (IQ3) | 4.5% | 3.9% |
| Interquartile Range (IQR) | 3.1% | 2.0% |
| Standard Deviation (Sample) | 1.9% | 1.7% |
| Standard Deviation (Population) | 1.9% | 1.7% |
Similar Demographics by Professional Degree
Demographics Similar to Immigrants from Cabo Verde by Professional Degree
In terms of professional degree, the demographic groups most similar to Immigrants from Cabo Verde are Bangladeshi (3.1%, a difference of 0.080%), Kiowa (3.1%, a difference of 0.12%), Yakama (3.1%, a difference of 0.23%), Puget Sound Salish (3.1%, a difference of 0.26%), and Creek (3.1%, a difference of 0.29%).
| Demographics | Rating | Rank | Professional Degree |
| Inupiat | 0.0 /100 | #323 | Tragic 3.2% |
| Crow | 0.0 /100 | #324 | Tragic 3.2% |
| Yaqui | 0.0 /100 | #325 | Tragic 3.2% |
| Menominee | 0.0 /100 | #326 | Tragic 3.1% |
| Dutch West Indians | 0.0 /100 | #327 | Tragic 3.1% |
| Creek | 0.0 /100 | #328 | Tragic 3.1% |
| Bangladeshis | 0.0 /100 | #329 | Tragic 3.1% |
| Immigrants | Cabo Verde | 0.0 /100 | #330 | Tragic 3.1% |
| Kiowa | 0.0 /100 | #331 | Tragic 3.1% |
| Yakama | 0.0 /100 | #332 | Tragic 3.1% |
| Puget Sound Salish | 0.0 /100 | #333 | Tragic 3.1% |
| Pennsylvania Germans | 0.0 /100 | #334 | Tragic 3.0% |
| Natives/Alaskans | 0.0 /100 | #335 | Tragic 3.0% |
| Fijians | 0.0 /100 | #336 | Tragic 2.9% |
| Arapaho | 0.0 /100 | #337 | Tragic 2.9% |
Demographics Similar to Alaskan Athabascans by Professional Degree
In terms of professional degree, the demographic groups most similar to Alaskan Athabascans are Native Hawaiian (3.8%, a difference of 0.0%), Immigrants from Ecuador (3.8%, a difference of 0.020%), Guamanian/Chamorro (3.8%, a difference of 0.080%), British West Indian (3.8%, a difference of 0.25%), and Immigrants from Bahamas (3.8%, a difference of 0.51%).
| Demographics | Rating | Rank | Professional Degree |
| Immigrants | Nonimmigrants | 4.0 /100 | #234 | Tragic 3.9% |
| Immigrants | Barbados | 4.0 /100 | #235 | Tragic 3.9% |
| Spanish Americans | 3.8 /100 | #236 | Tragic 3.9% |
| Immigrants | Trinidad and Tobago | 3.8 /100 | #237 | Tragic 3.9% |
| Colville | 2.6 /100 | #238 | Tragic 3.8% |
| British West Indians | 2.4 /100 | #239 | Tragic 3.8% |
| Immigrants | Ecuador | 2.3 /100 | #240 | Tragic 3.8% |
| Alaskan Athabascans | 2.3 /100 | #241 | Tragic 3.8% |
| Native Hawaiians | 2.3 /100 | #242 | Tragic 3.8% |
| Guamanians/Chamorros | 2.2 /100 | #243 | Tragic 3.8% |
| Immigrants | Bahamas | 2.0 /100 | #244 | Tragic 3.8% |
| French American Indians | 1.7 /100 | #245 | Tragic 3.8% |
| Marshallese | 1.7 /100 | #246 | Tragic 3.8% |
| Guyanese | 1.6 /100 | #247 | Tragic 3.8% |
| Hmong | 1.6 /100 | #248 | Tragic 3.7% |