Immigrants from Bulgaria vs Puget Sound Salish 12th Grade, No Diploma
COMPARE
Immigrants from Bulgaria
Puget Sound Salish
12th Grade, No Diploma
12th Grade, No Diploma Comparison
Immigrants from Bulgaria
Puget Sound Salish
92.5%
12TH GRADE, NO DIPLOMA
99.1/ 100
METRIC RATING
84th/ 347
METRIC RANK
92.0%
12TH GRADE, NO DIPLOMA
95.8/ 100
METRIC RATING
118th/ 347
METRIC RANK
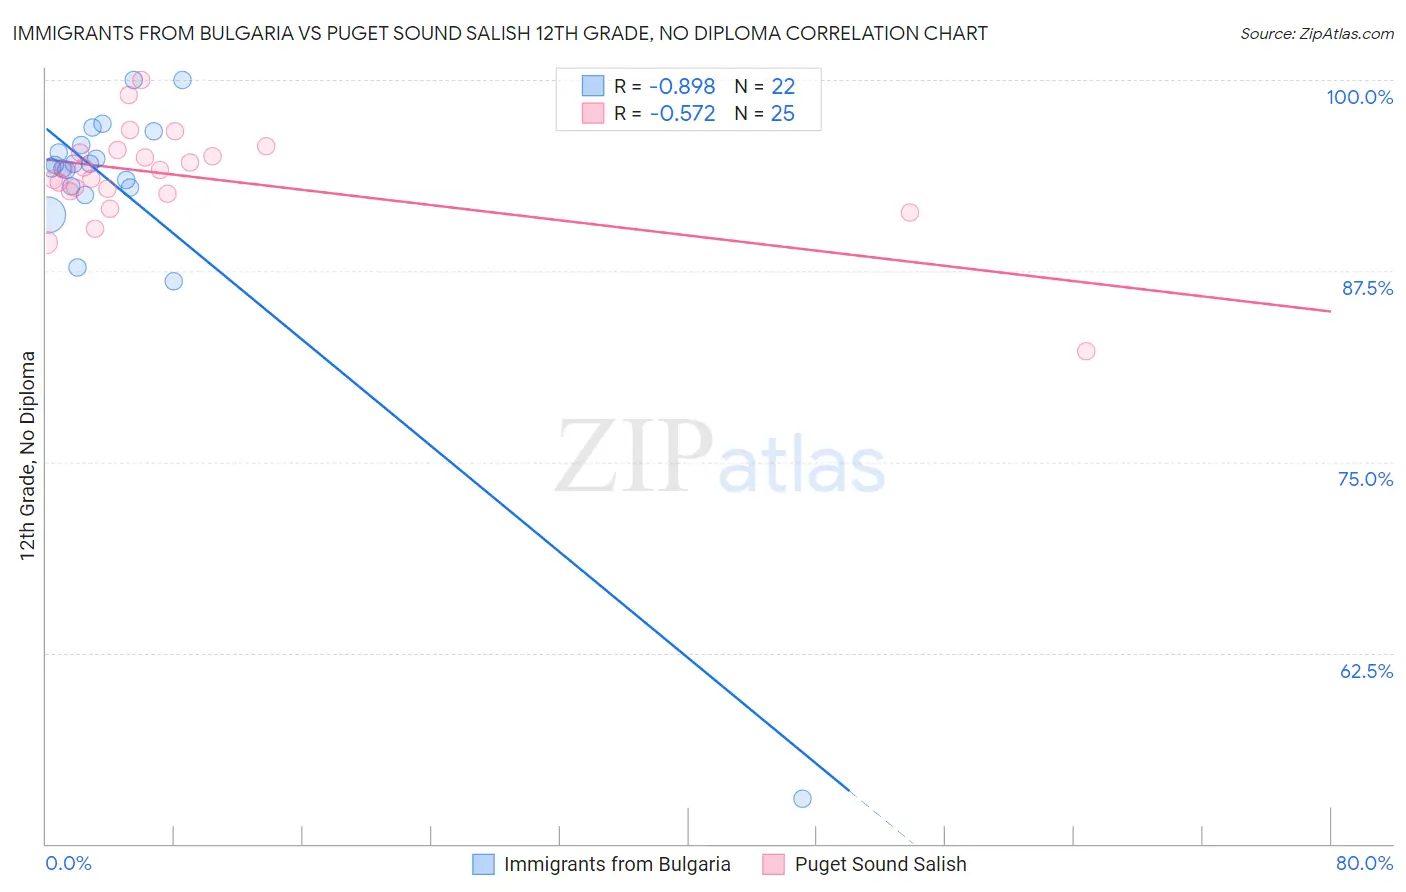
Immigrants from Bulgaria vs Puget Sound Salish 12th Grade, No Diploma Correlation Chart
The statistical analysis conducted on geographies consisting of 172,552,181 people shows a very strong negative correlation between the proportion of Immigrants from Bulgaria and percentage of population with at least 12th grade (no diploma) education in the United States with a correlation coefficient (R) of -0.898 and weighted average of 92.5%. Similarly, the statistical analysis conducted on geographies consisting of 46,155,775 people shows a substantial negative correlation between the proportion of Puget Sound Salish and percentage of population with at least 12th grade (no diploma) education in the United States with a correlation coefficient (R) of -0.572 and weighted average of 92.0%, a difference of 0.47%.
12th Grade, No Diploma Correlation Summary
| Measurement | Immigrants from Bulgaria | Puget Sound Salish |
| Minimum | 52.9% | 82.2% |
| Maximum | 100.0% | 100.0% |
| Range | 47.1% | 17.8% |
| Mean | 92.4% | 93.7% |
| Median | 94.4% | 94.1% |
| Interquartile 25% (IQ1) | 93.0% | 92.6% |
| Interquartile 75% (IQ3) | 95.8% | 95.3% |
| Interquartile Range (IQR) | 2.8% | 2.7% |
| Standard Deviation (Sample) | 9.4% | 3.4% |
| Standard Deviation (Population) | 9.1% | 3.3% |
Similar Demographics by 12th Grade, No Diploma
Demographics Similar to Immigrants from Bulgaria by 12th Grade, No Diploma
In terms of 12th grade, no diploma, the demographic groups most similar to Immigrants from Bulgaria are Immigrants from Saudi Arabia (92.5%, a difference of 0.020%), Immigrants from Israel (92.5%, a difference of 0.050%), Immigrants from Denmark (92.5%, a difference of 0.060%), Immigrants from Switzerland (92.5%, a difference of 0.060%), and Immigrants from Turkey (92.4%, a difference of 0.060%).
| Demographics | Rating | Rank | 12th Grade, No Diploma |
| Immigrants | England | 99.4 /100 | #77 | Exceptional 92.6% |
| Cambodians | 99.3 /100 | #78 | Exceptional 92.6% |
| Romanians | 99.3 /100 | #79 | Exceptional 92.6% |
| French Canadians | 99.3 /100 | #80 | Exceptional 92.6% |
| Immigrants | Denmark | 99.2 /100 | #81 | Exceptional 92.5% |
| Immigrants | Switzerland | 99.2 /100 | #82 | Exceptional 92.5% |
| Immigrants | Israel | 99.2 /100 | #83 | Exceptional 92.5% |
| Immigrants | Bulgaria | 99.1 /100 | #84 | Exceptional 92.5% |
| Immigrants | Saudi Arabia | 99.0 /100 | #85 | Exceptional 92.5% |
| Immigrants | Turkey | 98.9 /100 | #86 | Exceptional 92.4% |
| Immigrants | France | 98.8 /100 | #87 | Exceptional 92.4% |
| Scotch-Irish | 98.8 /100 | #88 | Exceptional 92.4% |
| Canadians | 98.7 /100 | #89 | Exceptional 92.4% |
| Immigrants | Serbia | 98.6 /100 | #90 | Exceptional 92.4% |
| South Africans | 98.6 /100 | #91 | Exceptional 92.4% |
Demographics Similar to Puget Sound Salish by 12th Grade, No Diploma
In terms of 12th grade, no diploma, the demographic groups most similar to Puget Sound Salish are Immigrants from Germany (92.0%, a difference of 0.030%), Aleut (92.1%, a difference of 0.040%), Immigrants from Eastern Europe (92.1%, a difference of 0.040%), Immigrants from Zimbabwe (92.1%, a difference of 0.050%), and Yugoslavian (92.1%, a difference of 0.050%).
| Demographics | Rating | Rank | 12th Grade, No Diploma |
| Immigrants | Greece | 96.9 /100 | #111 | Exceptional 92.1% |
| Israelis | 96.8 /100 | #112 | Exceptional 92.1% |
| Immigrants | Zimbabwe | 96.5 /100 | #113 | Exceptional 92.1% |
| Yugoslavians | 96.5 /100 | #114 | Exceptional 92.1% |
| Immigrants | Sri Lanka | 96.4 /100 | #115 | Exceptional 92.1% |
| Aleuts | 96.3 /100 | #116 | Exceptional 92.1% |
| Immigrants | Eastern Europe | 96.3 /100 | #117 | Exceptional 92.1% |
| Puget Sound Salish | 95.8 /100 | #118 | Exceptional 92.0% |
| Immigrants | Germany | 95.5 /100 | #119 | Exceptional 92.0% |
| Immigrants | Kazakhstan | 94.2 /100 | #120 | Exceptional 91.9% |
| Menominee | 93.5 /100 | #121 | Exceptional 91.9% |
| Ottawa | 93.1 /100 | #122 | Exceptional 91.9% |
| Egyptians | 92.5 /100 | #123 | Exceptional 91.9% |
| Immigrants | Ukraine | 91.6 /100 | #124 | Exceptional 91.8% |
| Whites/Caucasians | 91.6 /100 | #125 | Exceptional 91.8% |