Immigrants from Bulgaria vs Osage 2nd Grade
COMPARE
Immigrants from Bulgaria
Osage
2nd Grade
2nd Grade Comparison
Immigrants from Bulgaria
Osage
98.0%
2ND GRADE
89.7/ 100
METRIC RATING
135th/ 347
METRIC RANK
98.2%
2ND GRADE
99.2/ 100
METRIC RATING
80th/ 347
METRIC RANK
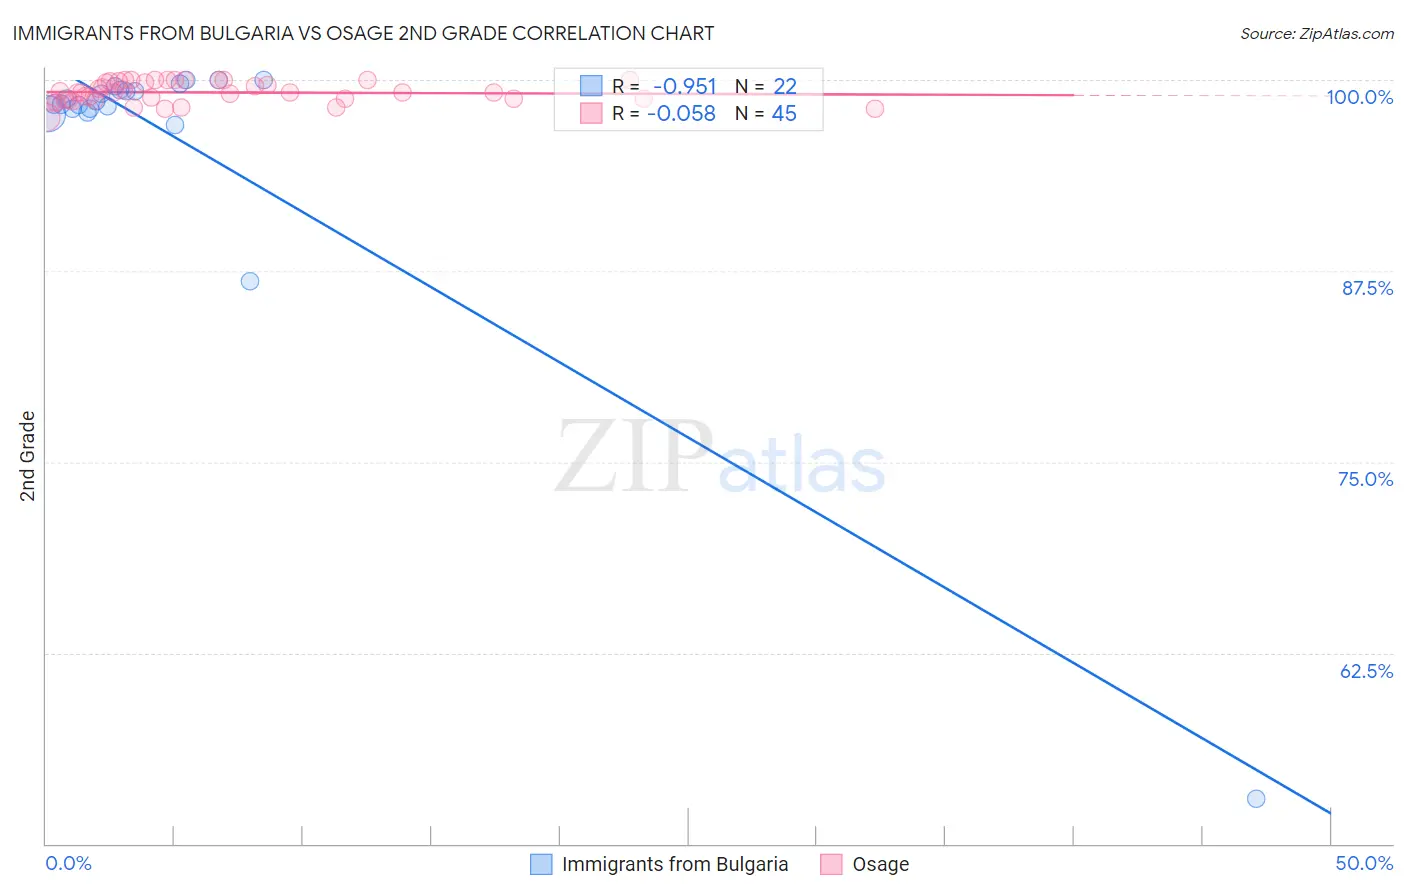
Immigrants from Bulgaria vs Osage 2nd Grade Correlation Chart
The statistical analysis conducted on geographies consisting of 172,552,181 people shows a perfect negative correlation between the proportion of Immigrants from Bulgaria and percentage of population with at least 2nd grade education in the United States with a correlation coefficient (R) of -0.951 and weighted average of 98.0%. Similarly, the statistical analysis conducted on geographies consisting of 91,808,929 people shows a slight negative correlation between the proportion of Osage and percentage of population with at least 2nd grade education in the United States with a correlation coefficient (R) of -0.058 and weighted average of 98.2%, a difference of 0.21%.
2nd Grade Correlation Summary
| Measurement | Immigrants from Bulgaria | Osage |
| Minimum | 52.9% | 97.5% |
| Maximum | 100.0% | 100.0% |
| Range | 47.1% | 2.5% |
| Mean | 96.2% | 99.2% |
| Median | 98.5% | 99.2% |
| Interquartile 25% (IQ1) | 98.1% | 98.7% |
| Interquartile 75% (IQ3) | 99.4% | 99.9% |
| Interquartile Range (IQR) | 1.2% | 1.2% |
| Standard Deviation (Sample) | 10.0% | 0.67% |
| Standard Deviation (Population) | 9.8% | 0.66% |
Similar Demographics by 2nd Grade
Demographics Similar to Immigrants from Bulgaria by 2nd Grade
In terms of 2nd grade, the demographic groups most similar to Immigrants from Bulgaria are Immigrants from Hungary (98.0%, a difference of 0.0%), Immigrants from Kuwait (98.0%, a difference of 0.0%), Seminole (98.0%, a difference of 0.010%), Immigrants from Europe (98.0%, a difference of 0.010%), and Spaniard (98.0%, a difference of 0.010%).
| Demographics | Rating | Rank | 2nd Grade |
| Immigrants | Serbia | 92.3 /100 | #128 | Exceptional 98.1% |
| Immigrants | Croatia | 92.1 /100 | #129 | Exceptional 98.1% |
| Seminole | 91.1 /100 | #130 | Exceptional 98.0% |
| Immigrants | Europe | 91.1 /100 | #131 | Exceptional 98.0% |
| Spaniards | 90.7 /100 | #132 | Exceptional 98.0% |
| Cambodians | 90.7 /100 | #133 | Exceptional 98.0% |
| Immigrants | Hungary | 89.7 /100 | #134 | Excellent 98.0% |
| Immigrants | Bulgaria | 89.7 /100 | #135 | Excellent 98.0% |
| Immigrants | Kuwait | 89.2 /100 | #136 | Excellent 98.0% |
| Immigrants | Romania | 88.3 /100 | #137 | Excellent 98.0% |
| Israelis | 87.9 /100 | #138 | Excellent 98.0% |
| Blackfeet | 87.5 /100 | #139 | Excellent 98.0% |
| Palestinians | 83.9 /100 | #140 | Excellent 98.0% |
| Immigrants | Turkey | 83.0 /100 | #141 | Excellent 98.0% |
| Burmese | 81.0 /100 | #142 | Excellent 98.0% |
Demographics Similar to Osage by 2nd Grade
In terms of 2nd grade, the demographic groups most similar to Osage are Immigrants from Lithuania (98.2%, a difference of 0.0%), Immigrants from Belgium (98.2%, a difference of 0.0%), Shoshone (98.3%, a difference of 0.010%), Cherokee (98.3%, a difference of 0.010%), and Immigrants from England (98.3%, a difference of 0.010%).
| Demographics | Rating | Rank | 2nd Grade |
| Cajuns | 99.5 /100 | #73 | Exceptional 98.3% |
| Immigrants | Netherlands | 99.4 /100 | #74 | Exceptional 98.3% |
| Shoshone | 99.4 /100 | #75 | Exceptional 98.3% |
| Cherokee | 99.4 /100 | #76 | Exceptional 98.3% |
| Immigrants | England | 99.4 /100 | #77 | Exceptional 98.3% |
| Immigrants | Lithuania | 99.3 /100 | #78 | Exceptional 98.2% |
| Immigrants | Belgium | 99.3 /100 | #79 | Exceptional 98.2% |
| Osage | 99.2 /100 | #80 | Exceptional 98.2% |
| Icelanders | 99.2 /100 | #81 | Exceptional 98.2% |
| Delaware | 99.1 /100 | #82 | Exceptional 98.2% |
| Immigrants | Sweden | 99.1 /100 | #83 | Exceptional 98.2% |
| Hopi | 99.1 /100 | #84 | Exceptional 98.2% |
| Potawatomi | 99.1 /100 | #85 | Exceptional 98.2% |
| Immigrants | Australia | 99.0 /100 | #86 | Exceptional 98.2% |
| Immigrants | Denmark | 99.0 /100 | #87 | Exceptional 98.2% |