Immigrants from Bulgaria vs Chilean Associate's Degree
COMPARE
Immigrants from Bulgaria
Chilean
Associate's Degree
Associate's Degree Comparison
Immigrants from Bulgaria
Chileans
52.4%
ASSOCIATE'S DEGREE
99.9/ 100
METRIC RATING
46th/ 347
METRIC RANK
49.4%
ASSOCIATE'S DEGREE
97.3/ 100
METRIC RATING
102nd/ 347
METRIC RANK
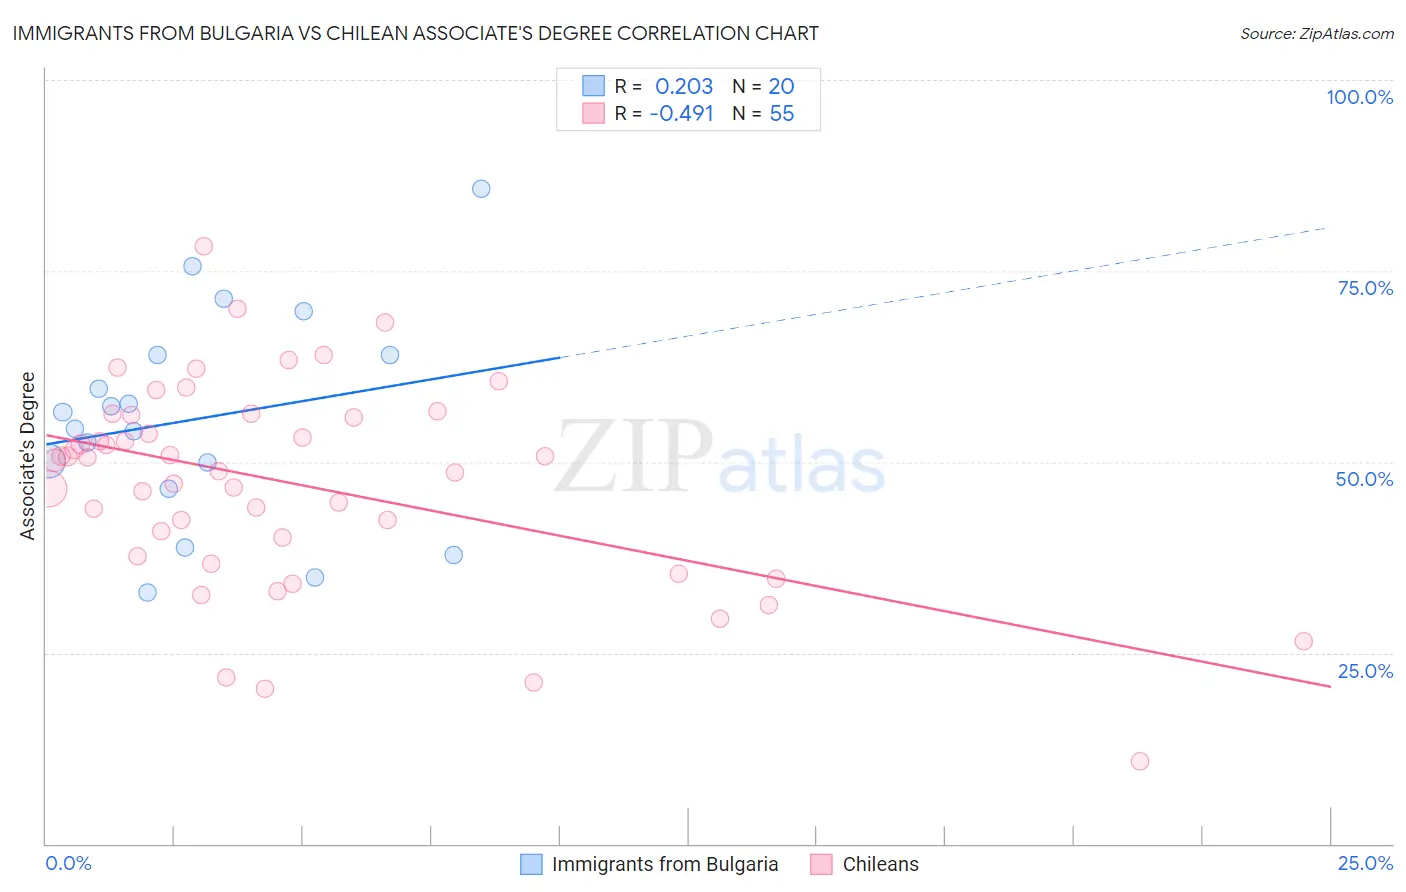
Immigrants from Bulgaria vs Chilean Associate's Degree Correlation Chart
The statistical analysis conducted on geographies consisting of 172,549,252 people shows a weak positive correlation between the proportion of Immigrants from Bulgaria and percentage of population with at least associate's degree education in the United States with a correlation coefficient (R) of 0.203 and weighted average of 52.4%. Similarly, the statistical analysis conducted on geographies consisting of 256,684,279 people shows a moderate negative correlation between the proportion of Chileans and percentage of population with at least associate's degree education in the United States with a correlation coefficient (R) of -0.491 and weighted average of 49.4%, a difference of 5.9%.
Associate's Degree Correlation Summary
| Measurement | Immigrants from Bulgaria | Chilean |
| Minimum | 32.8% | 10.9% |
| Maximum | 85.8% | 78.2% |
| Range | 52.9% | 67.3% |
| Mean | 55.7% | 47.1% |
| Median | 55.5% | 50.2% |
| Interquartile 25% (IQ1) | 48.2% | 37.6% |
| Interquartile 75% (IQ3) | 64.0% | 56.1% |
| Interquartile Range (IQR) | 15.8% | 18.5% |
| Standard Deviation (Sample) | 13.8% | 13.4% |
| Standard Deviation (Population) | 13.5% | 13.3% |
Similar Demographics by Associate's Degree
Demographics Similar to Immigrants from Bulgaria by Associate's Degree
In terms of associate's degree, the demographic groups most similar to Immigrants from Bulgaria are Immigrants from Kuwait (52.4%, a difference of 0.010%), Immigrants from Lithuania (52.4%, a difference of 0.13%), Estonian (52.5%, a difference of 0.21%), Immigrants from Norway (52.2%, a difference of 0.27%), and Immigrants from South Africa (52.5%, a difference of 0.30%).
| Demographics | Rating | Rank | Associate's Degree |
| Immigrants | Belarus | 99.9 /100 | #39 | Exceptional 52.8% |
| Immigrants | Latvia | 99.9 /100 | #40 | Exceptional 52.8% |
| Immigrants | Saudi Arabia | 99.9 /100 | #41 | Exceptional 52.6% |
| Immigrants | Malaysia | 99.9 /100 | #42 | Exceptional 52.5% |
| Immigrants | South Africa | 99.9 /100 | #43 | Exceptional 52.5% |
| Estonians | 99.9 /100 | #44 | Exceptional 52.5% |
| Immigrants | Lithuania | 99.9 /100 | #45 | Exceptional 52.4% |
| Immigrants | Bulgaria | 99.9 /100 | #46 | Exceptional 52.4% |
| Immigrants | Kuwait | 99.9 /100 | #47 | Exceptional 52.4% |
| Immigrants | Norway | 99.9 /100 | #48 | Exceptional 52.2% |
| Immigrants | Austria | 99.9 /100 | #49 | Exceptional 52.1% |
| Asians | 99.9 /100 | #50 | Exceptional 52.1% |
| Immigrants | Greece | 99.9 /100 | #51 | Exceptional 52.1% |
| Bolivians | 99.8 /100 | #52 | Exceptional 52.0% |
| Immigrants | Asia | 99.8 /100 | #53 | Exceptional 52.0% |
Demographics Similar to Chileans by Associate's Degree
In terms of associate's degree, the demographic groups most similar to Chileans are Northern European (49.5%, a difference of 0.030%), Ukrainian (49.4%, a difference of 0.11%), Venezuelan (49.4%, a difference of 0.17%), Immigrants from Nepal (49.5%, a difference of 0.19%), and Croatian (49.3%, a difference of 0.31%).
| Demographics | Rating | Rank | Associate's Degree |
| Immigrants | England | 98.0 /100 | #95 | Exceptional 49.7% |
| Romanians | 98.0 /100 | #96 | Exceptional 49.7% |
| Immigrants | Ukraine | 98.0 /100 | #97 | Exceptional 49.7% |
| Immigrants | Northern Africa | 97.9 /100 | #98 | Exceptional 49.7% |
| Macedonians | 97.8 /100 | #99 | Exceptional 49.6% |
| Immigrants | Nepal | 97.5 /100 | #100 | Exceptional 49.5% |
| Northern Europeans | 97.3 /100 | #101 | Exceptional 49.5% |
| Chileans | 97.3 /100 | #102 | Exceptional 49.4% |
| Ukrainians | 97.1 /100 | #103 | Exceptional 49.4% |
| Venezuelans | 97.0 /100 | #104 | Exceptional 49.4% |
| Croatians | 96.8 /100 | #105 | Exceptional 49.3% |
| Immigrants | Italy | 96.7 /100 | #106 | Exceptional 49.3% |
| Syrians | 96.7 /100 | #107 | Exceptional 49.3% |
| Jordanians | 96.6 /100 | #108 | Exceptional 49.2% |
| Immigrants | Morocco | 96.3 /100 | #109 | Exceptional 49.2% |