Immigrants from Brazil vs Apache 4th Grade
COMPARE
Immigrants from Brazil
Apache
4th Grade
4th Grade Comparison
Immigrants from Brazil
Apache
97.5%
4TH GRADE
46.1/ 100
METRIC RATING
177th/ 347
METRIC RANK
97.6%
4TH GRADE
61.3/ 100
METRIC RATING
160th/ 347
METRIC RANK
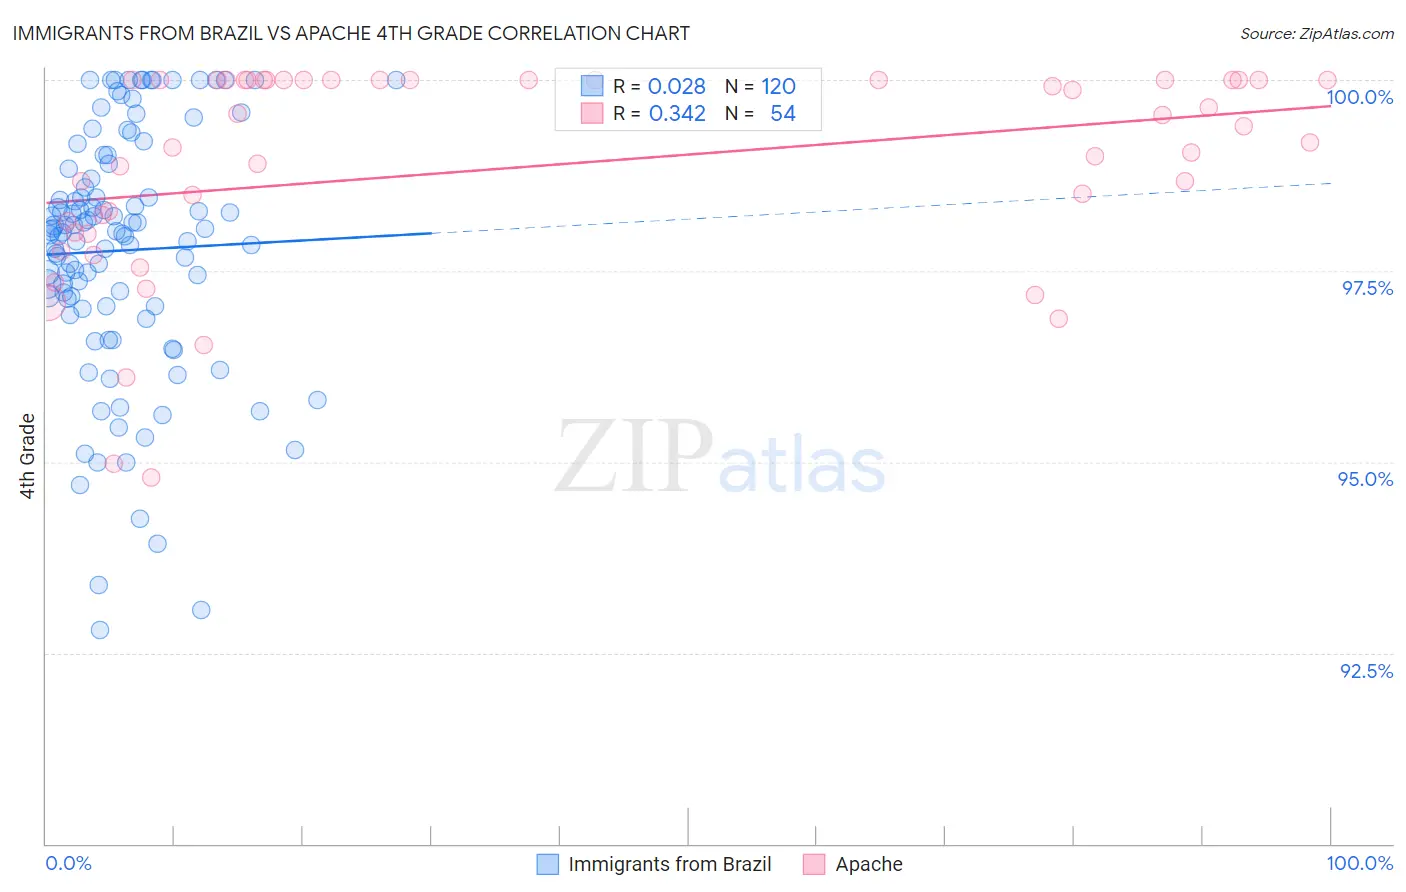
Immigrants from Brazil vs Apache 4th Grade Correlation Chart
The statistical analysis conducted on geographies consisting of 343,021,580 people shows no correlation between the proportion of Immigrants from Brazil and percentage of population with at least 4th grade education in the United States with a correlation coefficient (R) of 0.028 and weighted average of 97.5%. Similarly, the statistical analysis conducted on geographies consisting of 231,142,814 people shows a mild positive correlation between the proportion of Apache and percentage of population with at least 4th grade education in the United States with a correlation coefficient (R) of 0.342 and weighted average of 97.6%, a difference of 0.060%.
4th Grade Correlation Summary
| Measurement | Immigrants from Brazil | Apache |
| Minimum | 92.8% | 94.8% |
| Maximum | 100.0% | 100.0% |
| Range | 7.2% | 5.2% |
| Mean | 97.8% | 98.9% |
| Median | 98.0% | 99.3% |
| Interquartile 25% (IQ1) | 97.0% | 98.0% |
| Interquartile 75% (IQ3) | 98.8% | 100.0% |
| Interquartile Range (IQR) | 1.7% | 2.0% |
| Standard Deviation (Sample) | 1.6% | 1.4% |
| Standard Deviation (Population) | 1.6% | 1.3% |
Demographics Similar to Immigrants from Brazil and Apache by 4th Grade
In terms of 4th grade, the demographic groups most similar to Immigrants from Brazil are Comanche (97.5%, a difference of 0.0%), Egyptian (97.5%, a difference of 0.010%), Immigrants from Micronesia (97.5%, a difference of 0.010%), Arab (97.5%, a difference of 0.010%), and Immigrants from Spain (97.5%, a difference of 0.020%). Similarly, the demographic groups most similar to Apache are Marshallese (97.6%, a difference of 0.0%), Bermudan (97.6%, a difference of 0.0%), Immigrants from Iran (97.6%, a difference of 0.0%), Immigrants from Italy (97.6%, a difference of 0.010%), and Ugandan (97.6%, a difference of 0.010%).
| Demographics | Rating | Rank | 4th Grade |
| French American Indians | 65.9 /100 | #158 | Good 97.6% |
| Immigrants | Italy | 63.7 /100 | #159 | Good 97.6% |
| Apache | 61.3 /100 | #160 | Good 97.6% |
| Marshallese | 60.8 /100 | #161 | Good 97.6% |
| Bermudans | 60.5 /100 | #162 | Good 97.6% |
| Immigrants | Iran | 60.3 /100 | #163 | Good 97.6% |
| Ugandans | 58.9 /100 | #164 | Average 97.6% |
| Venezuelans | 58.7 /100 | #165 | Average 97.6% |
| Kenyans | 56.5 /100 | #166 | Average 97.5% |
| Immigrants | Poland | 55.9 /100 | #167 | Average 97.5% |
| Immigrants | Belarus | 55.8 /100 | #168 | Average 97.5% |
| Chileans | 54.4 /100 | #169 | Average 97.5% |
| Immigrants | Spain | 51.8 /100 | #170 | Average 97.5% |
| Brazilians | 51.5 /100 | #171 | Average 97.5% |
| Immigrants | Sri Lanka | 51.1 /100 | #172 | Average 97.5% |
| Immigrants | Korea | 50.6 /100 | #173 | Average 97.5% |
| Egyptians | 50.0 /100 | #174 | Average 97.5% |
| Immigrants | Micronesia | 49.6 /100 | #175 | Average 97.5% |
| Arabs | 48.7 /100 | #176 | Average 97.5% |
| Immigrants | Brazil | 46.1 /100 | #177 | Average 97.5% |
| Comanche | 45.3 /100 | #178 | Average 97.5% |