Immigrants from Bosnia and Herzegovina vs Haitian No Schooling Completed
COMPARE
Immigrants from Bosnia and Herzegovina
Haitian
No Schooling Completed
No Schooling Completed Comparison
Immigrants from Bosnia and Herzegovina
Haitians
2.1%
NO SCHOOLING COMPLETED
38.6/ 100
METRIC RATING
186th/ 347
METRIC RANK
2.9%
NO SCHOOLING COMPLETED
0.0/ 100
METRIC RATING
300th/ 347
METRIC RANK
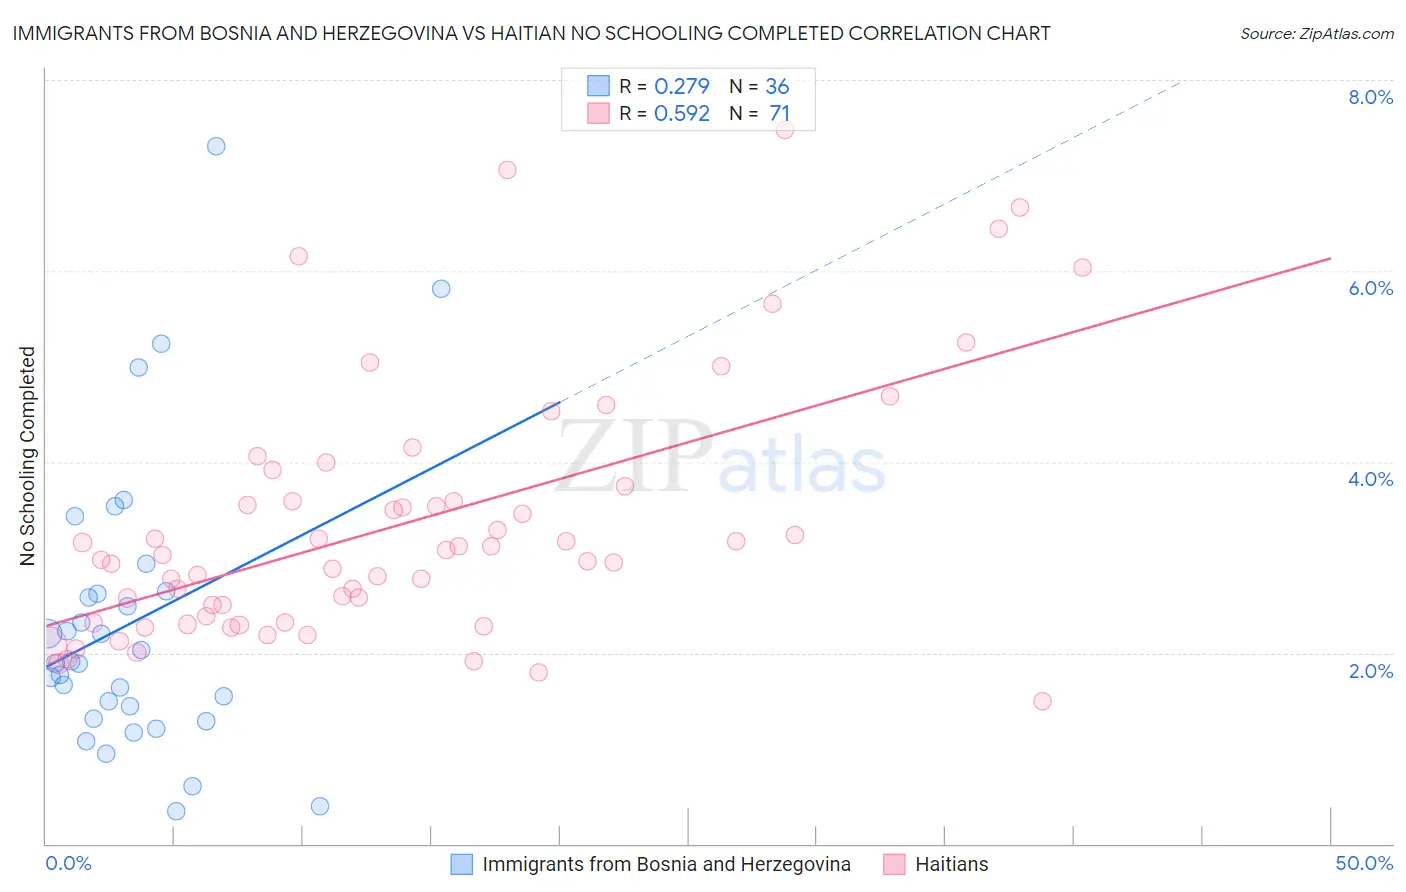
Immigrants from Bosnia and Herzegovina vs Haitian No Schooling Completed Correlation Chart
The statistical analysis conducted on geographies consisting of 156,377,328 people shows a weak positive correlation between the proportion of Immigrants from Bosnia and Herzegovina and percentage of population with no schooling in the United States with a correlation coefficient (R) of 0.279 and weighted average of 2.1%. Similarly, the statistical analysis conducted on geographies consisting of 286,255,737 people shows a substantial positive correlation between the proportion of Haitians and percentage of population with no schooling in the United States with a correlation coefficient (R) of 0.592 and weighted average of 2.9%, a difference of 34.4%.
No Schooling Completed Correlation Summary
| Measurement | Immigrants from Bosnia and Herzegovina | Haitian |
| Minimum | 0.34% | 1.5% |
| Maximum | 7.3% | 7.5% |
| Range | 7.0% | 6.0% |
| Mean | 2.3% | 3.4% |
| Median | 1.9% | 3.0% |
| Interquartile 25% (IQ1) | 1.4% | 2.3% |
| Interquartile 75% (IQ3) | 2.6% | 3.8% |
| Interquartile Range (IQR) | 1.3% | 1.4% |
| Standard Deviation (Sample) | 1.5% | 1.3% |
| Standard Deviation (Population) | 1.5% | 1.3% |
Similar Demographics by No Schooling Completed
Demographics Similar to Immigrants from Bosnia and Herzegovina by No Schooling Completed
In terms of no schooling completed, the demographic groups most similar to Immigrants from Bosnia and Herzegovina are Mongolian (2.1%, a difference of 0.30%), Navajo (2.1%, a difference of 0.30%), Immigrants from Kenya (2.1%, a difference of 0.35%), Immigrants from Egypt (2.1%, a difference of 0.36%), and Pima (2.1%, a difference of 0.37%).
| Demographics | Rating | Rank | No Schooling Completed |
| Immigrants | Kazakhstan | 44.3 /100 | #179 | Average 2.1% |
| Portuguese | 43.9 /100 | #180 | Average 2.1% |
| Immigrants | Taiwan | 42.6 /100 | #181 | Average 2.1% |
| French American Indians | 42.2 /100 | #182 | Average 2.1% |
| Blacks/African Americans | 41.4 /100 | #183 | Average 2.1% |
| Pima | 41.3 /100 | #184 | Average 2.1% |
| Mongolians | 40.8 /100 | #185 | Average 2.1% |
| Immigrants | Bosnia and Herzegovina | 38.6 /100 | #186 | Fair 2.1% |
| Navajo | 36.5 /100 | #187 | Fair 2.1% |
| Immigrants | Kenya | 36.2 /100 | #188 | Fair 2.1% |
| Immigrants | Egypt | 36.1 /100 | #189 | Fair 2.1% |
| Spanish Americans | 32.6 /100 | #190 | Fair 2.1% |
| Bermudans | 30.7 /100 | #191 | Fair 2.1% |
| Guamanians/Chamorros | 29.8 /100 | #192 | Fair 2.2% |
| Paraguayans | 29.3 /100 | #193 | Fair 2.2% |
Demographics Similar to Haitians by No Schooling Completed
In terms of no schooling completed, the demographic groups most similar to Haitians are Central American Indian (2.8%, a difference of 0.31%), Immigrants from Dominica (2.8%, a difference of 0.83%), Immigrants from Cuba (2.8%, a difference of 1.2%), Immigrants from South Eastern Asia (2.9%, a difference of 1.5%), and Immigrants from Caribbean (2.9%, a difference of 1.9%).
| Demographics | Rating | Rank | No Schooling Completed |
| Malaysians | 0.0 /100 | #293 | Tragic 2.8% |
| Immigrants | Eritrea | 0.0 /100 | #294 | Tragic 2.8% |
| Houma | 0.0 /100 | #295 | Tragic 2.8% |
| Immigrants | Immigrants | 0.0 /100 | #296 | Tragic 2.8% |
| Immigrants | Cuba | 0.0 /100 | #297 | Tragic 2.8% |
| Immigrants | Dominica | 0.0 /100 | #298 | Tragic 2.8% |
| Central American Indians | 0.0 /100 | #299 | Tragic 2.8% |
| Haitians | 0.0 /100 | #300 | Tragic 2.9% |
| Immigrants | South Eastern Asia | 0.0 /100 | #301 | Tragic 2.9% |
| Immigrants | Caribbean | 0.0 /100 | #302 | Tragic 2.9% |
| Somalis | 0.0 /100 | #303 | Tragic 2.9% |
| Nicaraguans | 0.0 /100 | #304 | Tragic 2.9% |
| Ecuadorians | 0.0 /100 | #305 | Tragic 3.0% |
| Belizeans | 0.0 /100 | #306 | Tragic 3.0% |
| Immigrants | Haiti | 0.0 /100 | #307 | Tragic 3.0% |