Immigrants from Belize vs Immigrants from the Azores Kindergarten
COMPARE
Immigrants from Belize
Immigrants from the Azores
Kindergarten
Kindergarten Comparison
Immigrants from Belize
Immigrants from the Azores
96.9%
KINDERGARTEN
0.0/ 100
METRIC RATING
315th/ 347
METRIC RANK
97.0%
KINDERGARTEN
0.0/ 100
METRIC RATING
310th/ 347
METRIC RANK
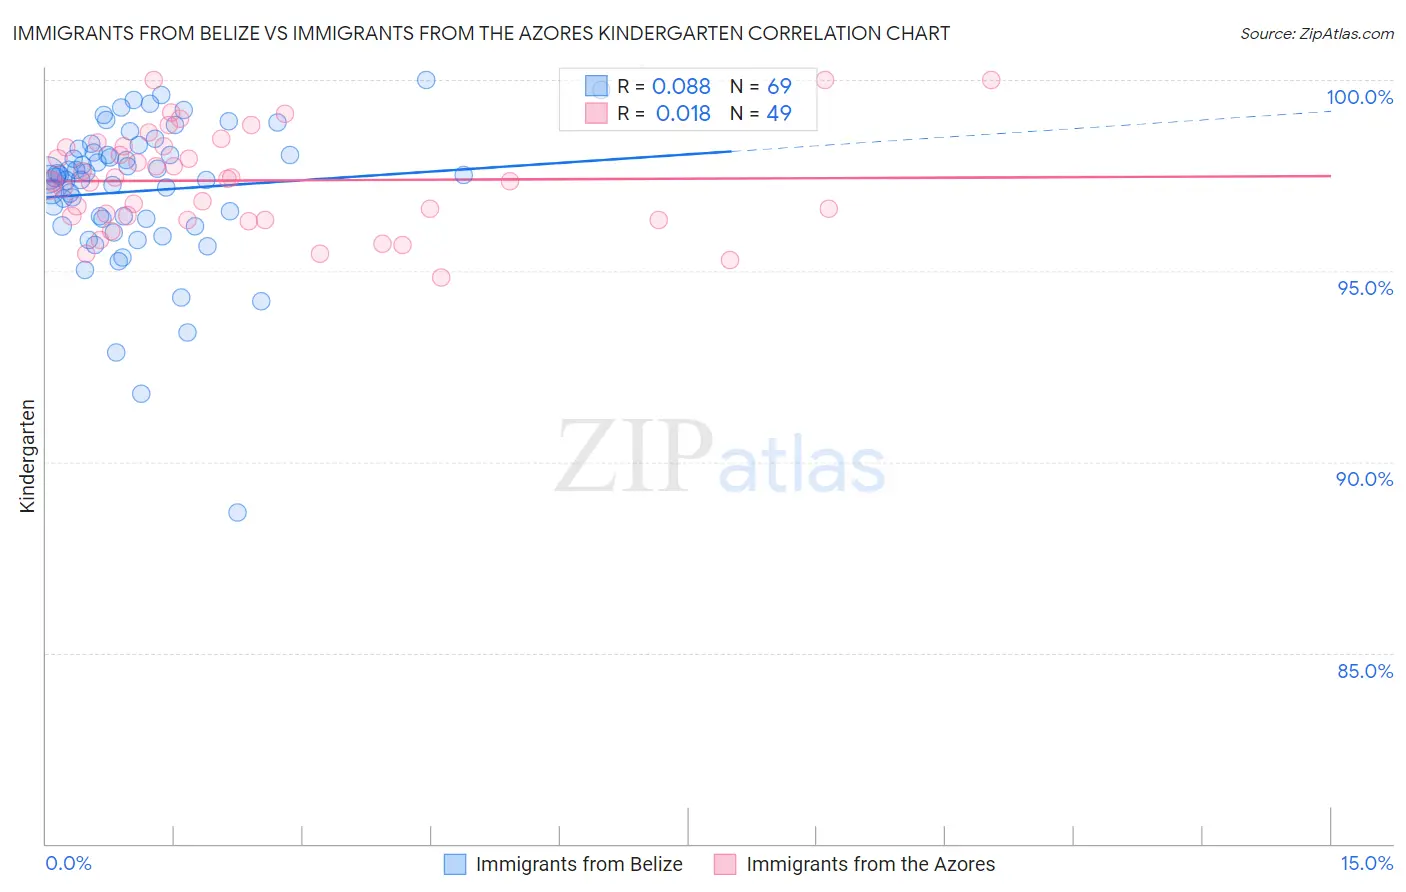
Immigrants from Belize vs Immigrants from the Azores Kindergarten Correlation Chart
The statistical analysis conducted on geographies consisting of 130,328,311 people shows a slight positive correlation between the proportion of Immigrants from Belize and percentage of population with at least kindergarten education in the United States with a correlation coefficient (R) of 0.088 and weighted average of 96.9%. Similarly, the statistical analysis conducted on geographies consisting of 46,257,310 people shows no correlation between the proportion of Immigrants from the Azores and percentage of population with at least kindergarten education in the United States with a correlation coefficient (R) of 0.018 and weighted average of 97.0%, a difference of 0.050%.
Kindergarten Correlation Summary
| Measurement | Immigrants from Belize | Immigrants from the Azores |
| Minimum | 88.7% | 94.8% |
| Maximum | 100.0% | 100.0% |
| Range | 11.3% | 5.2% |
| Mean | 97.1% | 97.4% |
| Median | 97.5% | 97.4% |
| Interquartile 25% (IQ1) | 96.3% | 96.4% |
| Interquartile 75% (IQ3) | 98.1% | 98.3% |
| Interquartile Range (IQR) | 1.9% | 1.9% |
| Standard Deviation (Sample) | 1.9% | 1.3% |
| Standard Deviation (Population) | 1.9% | 1.3% |
Demographics Similar to Immigrants from Belize and Immigrants from the Azores by Kindergarten
In terms of kindergarten, the demographic groups most similar to Immigrants from Belize are Honduran (96.9%, a difference of 0.010%), Immigrants from Nicaragua (96.9%, a difference of 0.010%), Immigrants from Ecuador (96.9%, a difference of 0.010%), Cape Verdean (96.9%, a difference of 0.020%), and Guyanese (96.9%, a difference of 0.030%). Similarly, the demographic groups most similar to Immigrants from the Azores are Immigrants from Haiti (97.0%, a difference of 0.0%), Sri Lankan (97.0%, a difference of 0.0%), Immigrants from Somalia (97.0%, a difference of 0.010%), Hispanic or Latino (97.0%, a difference of 0.020%), and Guyanese (96.9%, a difference of 0.020%).
| Demographics | Rating | Rank | Kindergarten |
| Immigrants | Caribbean | 0.0 /100 | #302 | Tragic 97.1% |
| Somalis | 0.0 /100 | #303 | Tragic 97.0% |
| Nicaraguans | 0.0 /100 | #304 | Tragic 97.0% |
| Ecuadorians | 0.0 /100 | #305 | Tragic 97.0% |
| Belizeans | 0.0 /100 | #306 | Tragic 97.0% |
| Hispanics or Latinos | 0.0 /100 | #307 | Tragic 97.0% |
| Immigrants | Somalia | 0.0 /100 | #308 | Tragic 97.0% |
| Immigrants | Haiti | 0.0 /100 | #309 | Tragic 97.0% |
| Immigrants | Azores | 0.0 /100 | #310 | Tragic 97.0% |
| Sri Lankans | 0.0 /100 | #311 | Tragic 97.0% |
| Guyanese | 0.0 /100 | #312 | Tragic 96.9% |
| Cape Verdeans | 0.0 /100 | #313 | Tragic 96.9% |
| Hondurans | 0.0 /100 | #314 | Tragic 96.9% |
| Immigrants | Belize | 0.0 /100 | #315 | Tragic 96.9% |
| Immigrants | Nicaragua | 0.0 /100 | #316 | Tragic 96.9% |
| Immigrants | Ecuador | 0.0 /100 | #317 | Tragic 96.9% |
| Immigrants | Laos | 0.0 /100 | #318 | Tragic 96.9% |
| Immigrants | Guyana | 0.0 /100 | #319 | Tragic 96.8% |
| Immigrants | Burma/Myanmar | 0.0 /100 | #320 | Tragic 96.8% |
| Immigrants | Bangladesh | 0.0 /100 | #321 | Tragic 96.8% |
| Mexican American Indians | 0.0 /100 | #322 | Tragic 96.8% |