Immigrants from Barbados vs Blackfeet Kindergarten
COMPARE
Immigrants from Barbados
Blackfeet
Kindergarten
Kindergarten Comparison
Immigrants from Barbados
Blackfeet
97.3%
KINDERGARTEN
0.0/ 100
METRIC RATING
286th/ 347
METRIC RANK
98.1%
KINDERGARTEN
87.8/ 100
METRIC RATING
137th/ 347
METRIC RANK
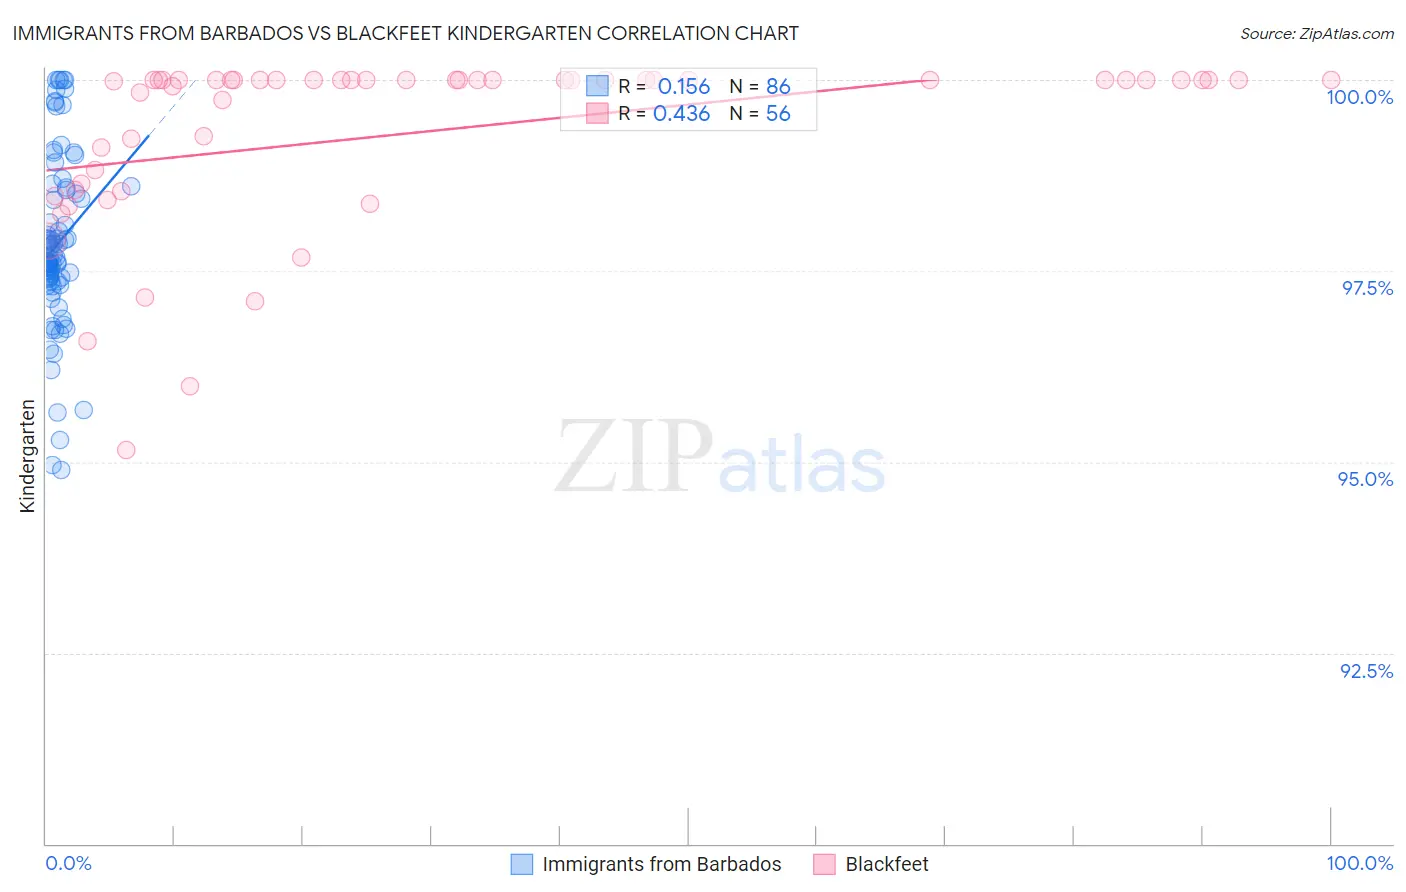
Immigrants from Barbados vs Blackfeet Kindergarten Correlation Chart
The statistical analysis conducted on geographies consisting of 112,787,503 people shows a poor positive correlation between the proportion of Immigrants from Barbados and percentage of population with at least kindergarten education in the United States with a correlation coefficient (R) of 0.156 and weighted average of 97.3%. Similarly, the statistical analysis conducted on geographies consisting of 309,580,957 people shows a moderate positive correlation between the proportion of Blackfeet and percentage of population with at least kindergarten education in the United States with a correlation coefficient (R) of 0.436 and weighted average of 98.1%, a difference of 0.80%.
Kindergarten Correlation Summary
| Measurement | Immigrants from Barbados | Blackfeet |
| Minimum | 94.9% | 95.2% |
| Maximum | 100.0% | 100.0% |
| Range | 5.1% | 4.8% |
| Mean | 97.9% | 99.3% |
| Median | 97.7% | 100.0% |
| Interquartile 25% (IQ1) | 97.4% | 98.6% |
| Interquartile 75% (IQ3) | 98.6% | 100.0% |
| Interquartile Range (IQR) | 1.2% | 1.4% |
| Standard Deviation (Sample) | 1.1% | 1.2% |
| Standard Deviation (Population) | 1.1% | 1.1% |
Similar Demographics by Kindergarten
Demographics Similar to Immigrants from Barbados by Kindergarten
In terms of kindergarten, the demographic groups most similar to Immigrants from Barbados are Immigrants from Hong Kong (97.3%, a difference of 0.0%), Immigrants from Portugal (97.3%, a difference of 0.010%), Immigrants from Thailand (97.3%, a difference of 0.010%), Immigrants from Trinidad and Tobago (97.3%, a difference of 0.020%), and Immigrants from West Indies (97.3%, a difference of 0.030%).
| Demographics | Rating | Rank | Kindergarten |
| Immigrants | Ghana | 0.1 /100 | #279 | Tragic 97.4% |
| Barbadians | 0.1 /100 | #280 | Tragic 97.4% |
| Trinidadians and Tobagonians | 0.1 /100 | #281 | Tragic 97.4% |
| Afghans | 0.0 /100 | #282 | Tragic 97.4% |
| Immigrants | West Indies | 0.0 /100 | #283 | Tragic 97.3% |
| Immigrants | Trinidad and Tobago | 0.0 /100 | #284 | Tragic 97.3% |
| Immigrants | Portugal | 0.0 /100 | #285 | Tragic 97.3% |
| Immigrants | Barbados | 0.0 /100 | #286 | Tragic 97.3% |
| Immigrants | Hong Kong | 0.0 /100 | #287 | Tragic 97.3% |
| Immigrants | Thailand | 0.0 /100 | #288 | Tragic 97.3% |
| Immigrants | Afghanistan | 0.0 /100 | #289 | Tragic 97.3% |
| Immigrants | St. Vincent and the Grenadines | 0.0 /100 | #290 | Tragic 97.3% |
| Houma | 0.0 /100 | #291 | Tragic 97.3% |
| British West Indians | 0.0 /100 | #292 | Tragic 97.3% |
| Malaysians | 0.0 /100 | #293 | Tragic 97.2% |
Demographics Similar to Blackfeet by Kindergarten
In terms of kindergarten, the demographic groups most similar to Blackfeet are Immigrants from Romania (98.1%, a difference of 0.0%), Israeli (98.1%, a difference of 0.0%), Immigrants from Bulgaria (98.1%, a difference of 0.010%), Immigrants from Kuwait (98.1%, a difference of 0.010%), and Immigrants from Hungary (98.1%, a difference of 0.010%).
| Demographics | Rating | Rank | Kindergarten |
| Immigrants | Croatia | 91.2 /100 | #130 | Exceptional 98.1% |
| Cambodians | 91.2 /100 | #131 | Exceptional 98.1% |
| Spaniards | 91.0 /100 | #132 | Exceptional 98.1% |
| Immigrants | Europe | 90.4 /100 | #133 | Exceptional 98.1% |
| Immigrants | Bulgaria | 89.4 /100 | #134 | Excellent 98.1% |
| Immigrants | Kuwait | 89.2 /100 | #135 | Excellent 98.1% |
| Immigrants | Hungary | 89.1 /100 | #136 | Excellent 98.1% |
| Blackfeet | 87.8 /100 | #137 | Excellent 98.1% |
| Immigrants | Romania | 87.7 /100 | #138 | Excellent 98.1% |
| Israelis | 87.7 /100 | #139 | Excellent 98.1% |
| Palestinians | 83.6 /100 | #140 | Excellent 98.1% |
| Marshallese | 83.0 /100 | #141 | Excellent 98.1% |
| Immigrants | Turkey | 82.8 /100 | #142 | Excellent 98.1% |
| Burmese | 81.5 /100 | #143 | Excellent 98.1% |
| Alsatians | 80.4 /100 | #144 | Excellent 98.1% |