Immigrants from Bangladesh vs Swiss 5th Grade
COMPARE
Immigrants from Bangladesh
Swiss
5th Grade
5th Grade Comparison
Immigrants from Bangladesh
Swiss
96.0%
5TH GRADE
0.0/ 100
METRIC RATING
311th/ 347
METRIC RANK
98.1%
5TH GRADE
100.0/ 100
METRIC RATING
33rd/ 347
METRIC RANK
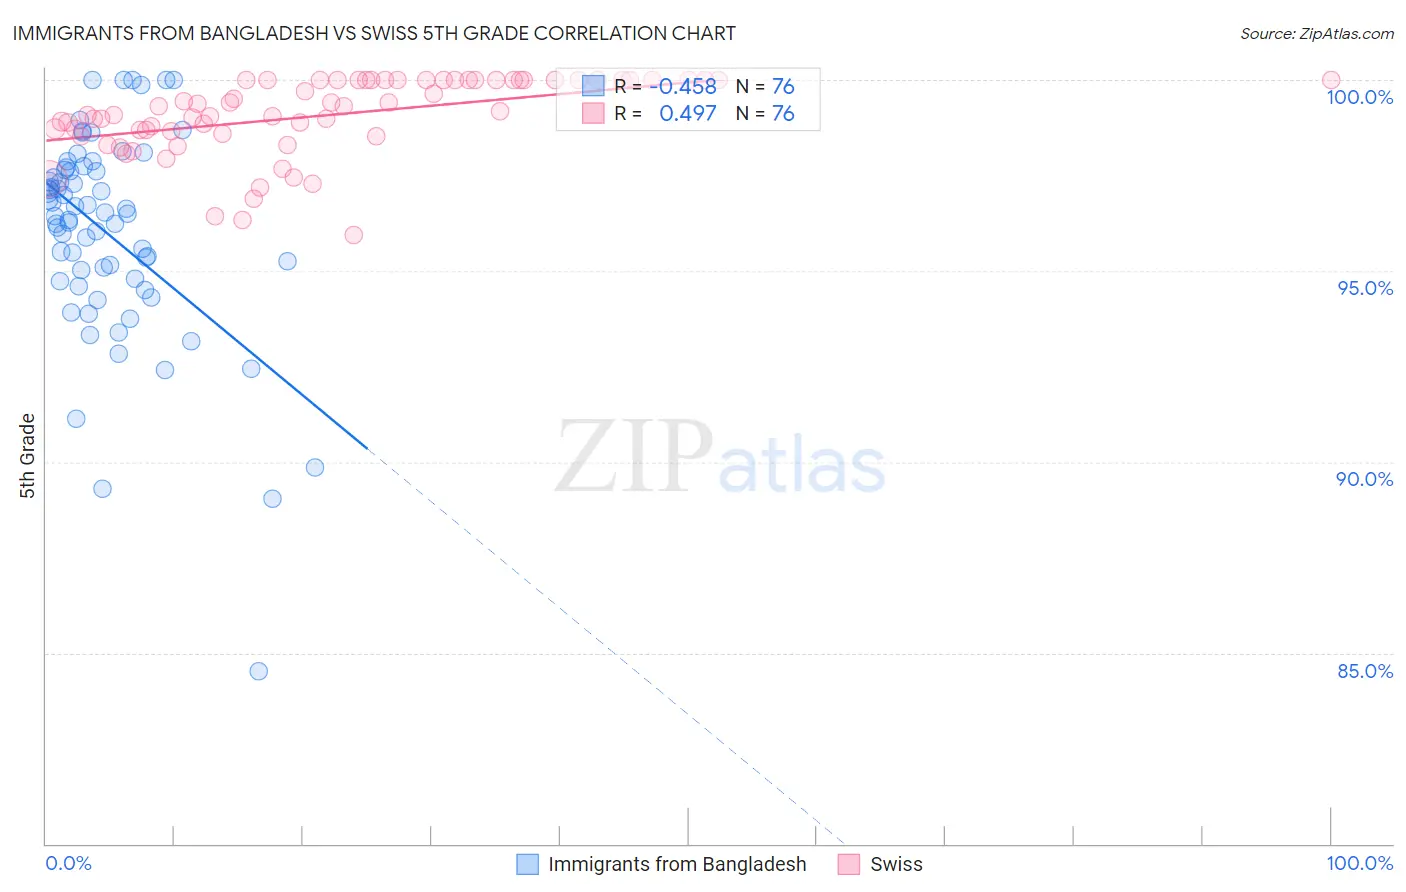
Immigrants from Bangladesh vs Swiss 5th Grade Correlation Chart
The statistical analysis conducted on geographies consisting of 203,672,706 people shows a moderate negative correlation between the proportion of Immigrants from Bangladesh and percentage of population with at least 5th grade education in the United States with a correlation coefficient (R) of -0.458 and weighted average of 96.0%. Similarly, the statistical analysis conducted on geographies consisting of 465,021,856 people shows a moderate positive correlation between the proportion of Swiss and percentage of population with at least 5th grade education in the United States with a correlation coefficient (R) of 0.497 and weighted average of 98.1%, a difference of 2.3%.
5th Grade Correlation Summary
| Measurement | Immigrants from Bangladesh | Swiss |
| Minimum | 84.5% | 95.9% |
| Maximum | 100.0% | 100.0% |
| Range | 15.5% | 4.1% |
| Mean | 96.0% | 99.1% |
| Median | 96.5% | 99.3% |
| Interquartile 25% (IQ1) | 94.8% | 98.6% |
| Interquartile 75% (IQ3) | 97.6% | 100.0% |
| Interquartile Range (IQR) | 2.9% | 1.4% |
| Standard Deviation (Sample) | 2.7% | 1.0% |
| Standard Deviation (Population) | 2.7% | 1.0% |
Similar Demographics by 5th Grade
Demographics Similar to Immigrants from Bangladesh by 5th Grade
In terms of 5th grade, the demographic groups most similar to Immigrants from Bangladesh are Indonesian (96.0%, a difference of 0.020%), Vietnamese (95.9%, a difference of 0.030%), Bangladeshi (95.9%, a difference of 0.050%), Immigrants from Portugal (95.9%, a difference of 0.050%), and Ecuadorian (96.0%, a difference of 0.070%).
| Demographics | Rating | Rank | 5th Grade |
| Immigrants | Burma/Myanmar | 0.0 /100 | #304 | Tragic 96.1% |
| Immigrants | Laos | 0.0 /100 | #305 | Tragic 96.0% |
| Immigrants | Haiti | 0.0 /100 | #306 | Tragic 96.0% |
| Immigrants | Caribbean | 0.0 /100 | #307 | Tragic 96.0% |
| Ecuadorians | 0.0 /100 | #308 | Tragic 96.0% |
| Immigrants | Guyana | 0.0 /100 | #309 | Tragic 96.0% |
| Indonesians | 0.0 /100 | #310 | Tragic 96.0% |
| Immigrants | Bangladesh | 0.0 /100 | #311 | Tragic 96.0% |
| Vietnamese | 0.0 /100 | #312 | Tragic 95.9% |
| Bangladeshis | 0.0 /100 | #313 | Tragic 95.9% |
| Immigrants | Portugal | 0.0 /100 | #314 | Tragic 95.9% |
| Nicaraguans | 0.0 /100 | #315 | Tragic 95.9% |
| Immigrants | Ecuador | 0.0 /100 | #316 | Tragic 95.8% |
| Belizeans | 0.0 /100 | #317 | Tragic 95.8% |
| Immigrants | Vietnam | 0.0 /100 | #318 | Tragic 95.8% |
Demographics Similar to Swiss by 5th Grade
In terms of 5th grade, the demographic groups most similar to Swiss are Chinese (98.1%, a difference of 0.0%), Chippewa (98.1%, a difference of 0.010%), Italian (98.1%, a difference of 0.010%), British (98.1%, a difference of 0.020%), and Latvian (98.1%, a difference of 0.040%).
| Demographics | Rating | Rank | 5th Grade |
| Alaska Natives | 100.0 /100 | #26 | Exceptional 98.2% |
| French | 100.0 /100 | #27 | Exceptional 98.2% |
| Czechs | 100.0 /100 | #28 | Exceptional 98.2% |
| Scandinavians | 100.0 /100 | #29 | Exceptional 98.2% |
| French Canadians | 100.0 /100 | #30 | Exceptional 98.2% |
| Europeans | 100.0 /100 | #31 | Exceptional 98.2% |
| Chippewa | 100.0 /100 | #32 | Exceptional 98.1% |
| Swiss | 100.0 /100 | #33 | Exceptional 98.1% |
| Chinese | 100.0 /100 | #34 | Exceptional 98.1% |
| Italians | 100.0 /100 | #35 | Exceptional 98.1% |
| British | 100.0 /100 | #36 | Exceptional 98.1% |
| Latvians | 99.9 /100 | #37 | Exceptional 98.1% |
| Belgians | 99.9 /100 | #38 | Exceptional 98.1% |
| Luxembourgers | 99.9 /100 | #39 | Exceptional 98.1% |
| Eastern Europeans | 99.9 /100 | #40 | Exceptional 98.1% |