Immigrants from Bahamas vs African 9th Grade
COMPARE
Immigrants from Bahamas
African
9th Grade
9th Grade Comparison
Immigrants from Bahamas
Africans
94.6%
9TH GRADE
19.8/ 100
METRIC RATING
203rd/ 347
METRIC RANK
94.5%
9TH GRADE
9.0/ 100
METRIC RATING
219th/ 347
METRIC RANK
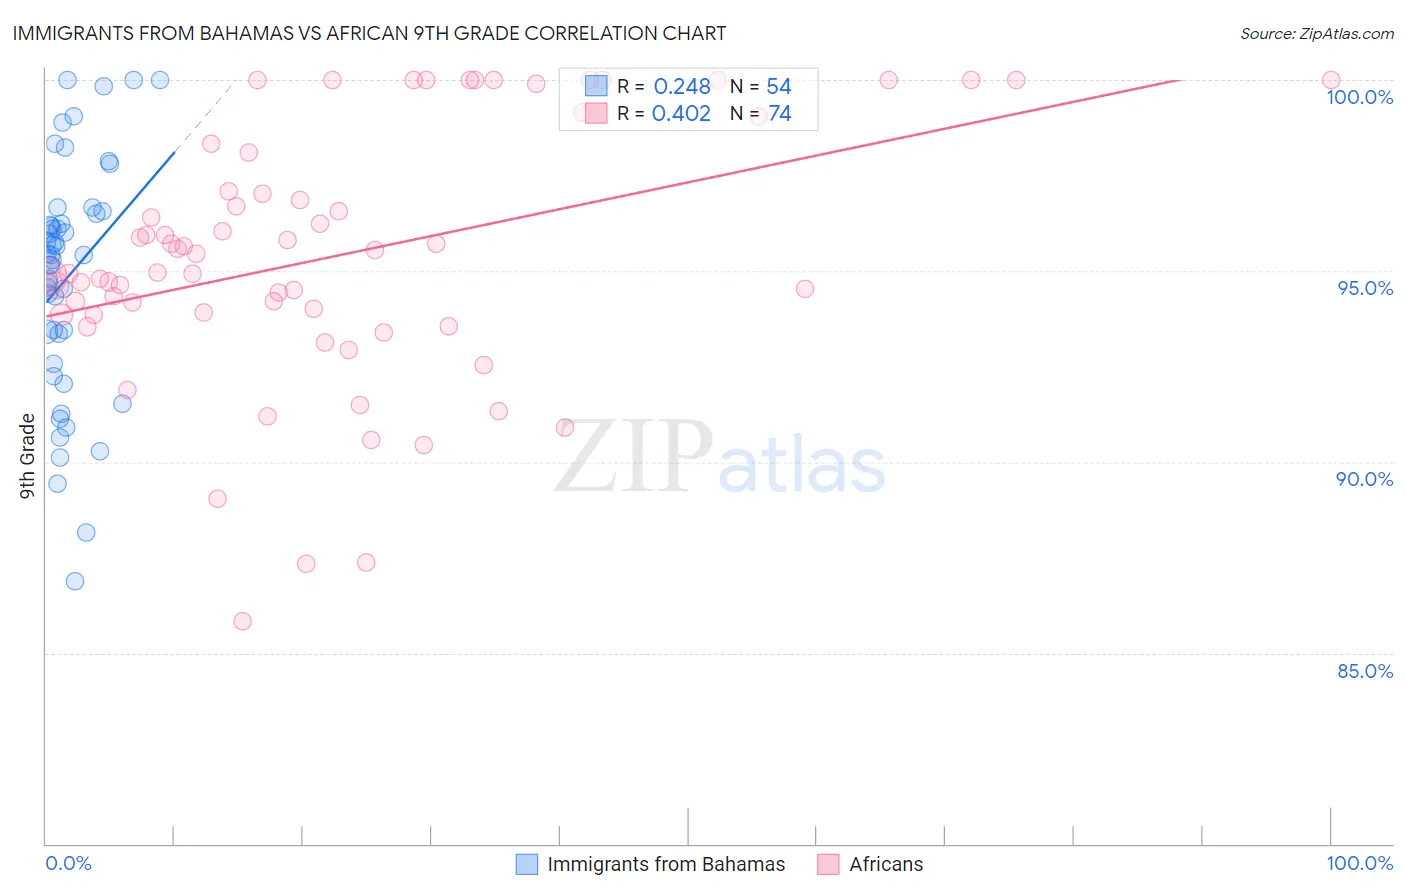
Immigrants from Bahamas vs African 9th Grade Correlation Chart
The statistical analysis conducted on geographies consisting of 104,666,801 people shows a weak positive correlation between the proportion of Immigrants from Bahamas and percentage of population with at least 9th grade education in the United States with a correlation coefficient (R) of 0.248 and weighted average of 94.6%. Similarly, the statistical analysis conducted on geographies consisting of 470,094,658 people shows a moderate positive correlation between the proportion of Africans and percentage of population with at least 9th grade education in the United States with a correlation coefficient (R) of 0.402 and weighted average of 94.5%, a difference of 0.17%.
9th Grade Correlation Summary
| Measurement | Immigrants from Bahamas | African |
| Minimum | 86.9% | 85.8% |
| Maximum | 100.0% | 100.0% |
| Range | 13.1% | 14.2% |
| Mean | 94.9% | 95.4% |
| Median | 95.4% | 95.2% |
| Interquartile 25% (IQ1) | 93.3% | 93.9% |
| Interquartile 75% (IQ3) | 96.5% | 98.1% |
| Interquartile Range (IQR) | 3.1% | 4.2% |
| Standard Deviation (Sample) | 3.0% | 3.3% |
| Standard Deviation (Population) | 3.0% | 3.3% |
Demographics Similar to Immigrants from Bahamas and Africans by 9th Grade
In terms of 9th grade, the demographic groups most similar to Immigrants from Bahamas are Immigrants from Eastern Asia (94.6%, a difference of 0.0%), Moroccan (94.6%, a difference of 0.0%), Black/African American (94.6%, a difference of 0.010%), Immigrants from Sudan (94.6%, a difference of 0.030%), and Samoan (94.6%, a difference of 0.030%). Similarly, the demographic groups most similar to Africans are Portuguese (94.5%, a difference of 0.0%), Indian (Asian) (94.5%, a difference of 0.010%), Asian (94.5%, a difference of 0.020%), Immigrants from Eastern Africa (94.5%, a difference of 0.020%), and Immigrants from Syria (94.5%, a difference of 0.040%).
| Demographics | Rating | Rank | 9th Grade |
| Blacks/African Americans | 20.5 /100 | #201 | Fair 94.6% |
| Immigrants | Eastern Asia | 19.8 /100 | #202 | Poor 94.6% |
| Immigrants | Bahamas | 19.8 /100 | #203 | Poor 94.6% |
| Moroccans | 19.6 /100 | #204 | Poor 94.6% |
| Immigrants | Sudan | 17.6 /100 | #205 | Poor 94.6% |
| Samoans | 17.3 /100 | #206 | Poor 94.6% |
| Immigrants | Morocco | 16.3 /100 | #207 | Poor 94.6% |
| Immigrants | Pakistan | 15.5 /100 | #208 | Poor 94.6% |
| Comanche | 14.9 /100 | #209 | Poor 94.6% |
| Immigrants | Chile | 13.4 /100 | #210 | Poor 94.5% |
| Immigrants | Indonesia | 12.3 /100 | #211 | Poor 94.5% |
| Immigrants | Malaysia | 12.2 /100 | #212 | Poor 94.5% |
| Immigrants | Oceania | 12.1 /100 | #213 | Poor 94.5% |
| Immigrants | Liberia | 11.8 /100 | #214 | Poor 94.5% |
| Immigrants | Syria | 11.0 /100 | #215 | Poor 94.5% |
| Immigrants | Western Asia | 10.7 /100 | #216 | Poor 94.5% |
| Asians | 9.9 /100 | #217 | Tragic 94.5% |
| Portuguese | 9.2 /100 | #218 | Tragic 94.5% |
| Africans | 9.0 /100 | #219 | Tragic 94.5% |
| Indians (Asian) | 8.6 /100 | #220 | Tragic 94.5% |
| Immigrants | Eastern Africa | 8.2 /100 | #221 | Tragic 94.5% |