Immigrants from the Azores vs Asian Nursery School
COMPARE
Immigrants from the Azores
Asian
Nursery School
Nursery School Comparison
Immigrants from the Azores
Asians
97.0%
NURSERY SCHOOL
0.0/ 100
METRIC RATING
311th/ 347
METRIC RANK
97.6%
NURSERY SCHOOL
1.1/ 100
METRIC RATING
243rd/ 347
METRIC RANK
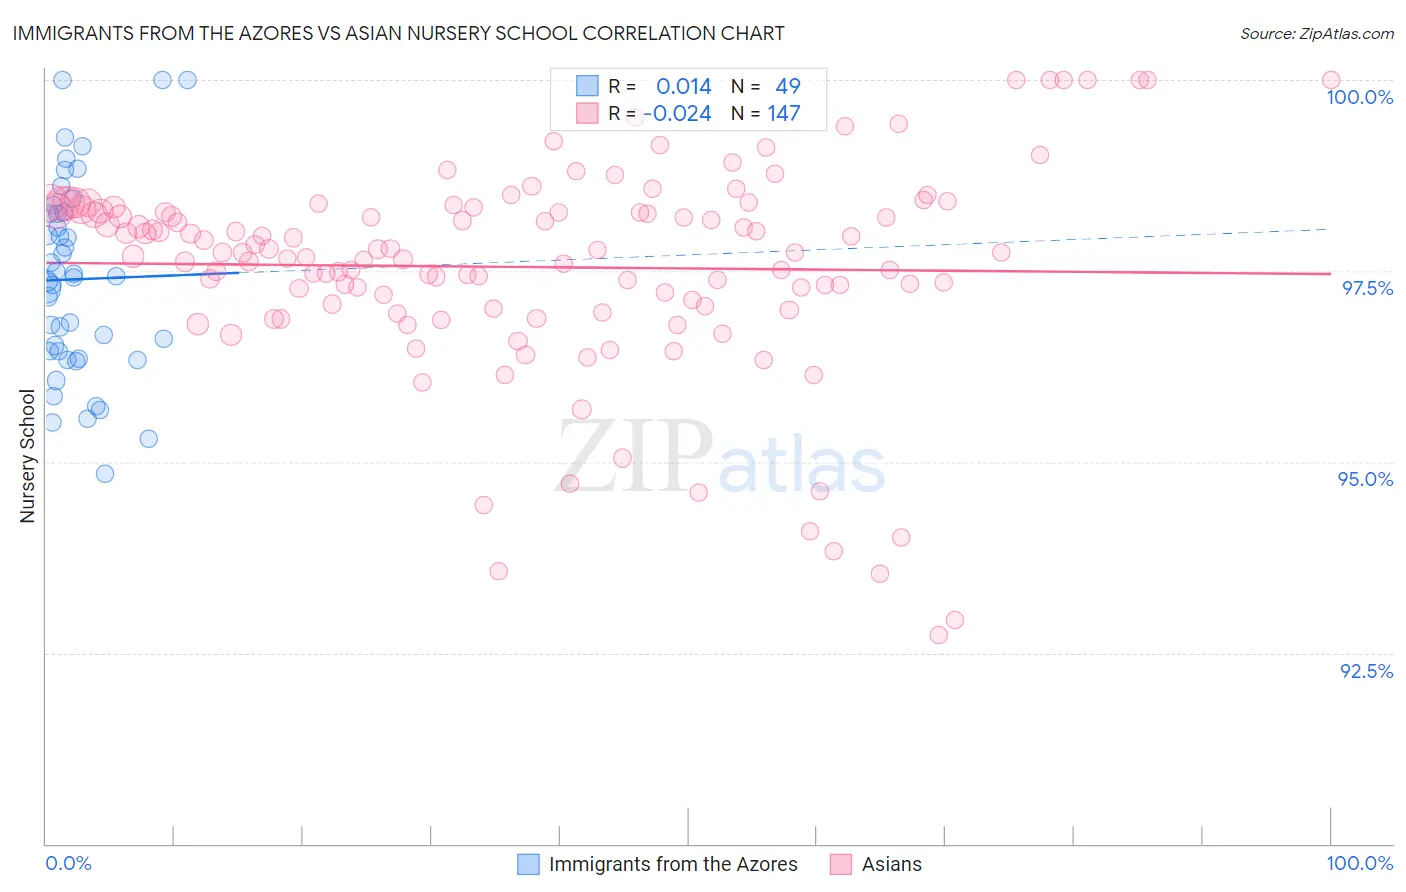
Immigrants from the Azores vs Asian Nursery School Correlation Chart
The statistical analysis conducted on geographies consisting of 46,257,310 people shows no correlation between the proportion of Immigrants from the Azores and percentage of population with at least nursery school education in the United States with a correlation coefficient (R) of 0.014 and weighted average of 97.0%. Similarly, the statistical analysis conducted on geographies consisting of 550,722,447 people shows no correlation between the proportion of Asians and percentage of population with at least nursery school education in the United States with a correlation coefficient (R) of -0.024 and weighted average of 97.6%, a difference of 0.68%.
Nursery School Correlation Summary
| Measurement | Immigrants from the Azores | Asian |
| Minimum | 94.8% | 92.7% |
| Maximum | 100.0% | 100.0% |
| Range | 5.2% | 7.3% |
| Mean | 97.4% | 97.6% |
| Median | 97.4% | 97.7% |
| Interquartile 25% (IQ1) | 96.4% | 97.0% |
| Interquartile 75% (IQ3) | 98.3% | 98.3% |
| Interquartile Range (IQR) | 1.9% | 1.3% |
| Standard Deviation (Sample) | 1.3% | 1.4% |
| Standard Deviation (Population) | 1.3% | 1.4% |
Similar Demographics by Nursery School
Demographics Similar to Immigrants from the Azores by Nursery School
In terms of nursery school, the demographic groups most similar to Immigrants from the Azores are Guyanese (97.0%, a difference of 0.0%), Sri Lankan (97.0%, a difference of 0.0%), Immigrants from Somalia (97.0%, a difference of 0.010%), Belizean (97.0%, a difference of 0.030%), and Hispanic or Latino (97.0%, a difference of 0.030%).
| Demographics | Rating | Rank | Nursery School |
| Ecuadorians | 0.0 /100 | #304 | Tragic 97.1% |
| Somalis | 0.0 /100 | #305 | Tragic 97.1% |
| Belizeans | 0.0 /100 | #306 | Tragic 97.0% |
| Hispanics or Latinos | 0.0 /100 | #307 | Tragic 97.0% |
| Immigrants | Haiti | 0.0 /100 | #308 | Tragic 97.0% |
| Immigrants | Somalia | 0.0 /100 | #309 | Tragic 97.0% |
| Guyanese | 0.0 /100 | #310 | Tragic 97.0% |
| Immigrants | Azores | 0.0 /100 | #311 | Tragic 97.0% |
| Sri Lankans | 0.0 /100 | #312 | Tragic 97.0% |
| Hondurans | 0.0 /100 | #313 | Tragic 97.0% |
| Cape Verdeans | 0.0 /100 | #314 | Tragic 97.0% |
| Immigrants | Nicaragua | 0.0 /100 | #315 | Tragic 96.9% |
| Immigrants | Belize | 0.0 /100 | #316 | Tragic 96.9% |
| Immigrants | Ecuador | 0.0 /100 | #317 | Tragic 96.9% |
| Immigrants | Guyana | 0.0 /100 | #318 | Tragic 96.9% |
Demographics Similar to Asians by Nursery School
In terms of nursery school, the demographic groups most similar to Asians are Liberian (97.7%, a difference of 0.0%), South American (97.6%, a difference of 0.0%), Bolivian (97.6%, a difference of 0.0%), Immigrants from Indonesia (97.7%, a difference of 0.010%), and Peruvian (97.6%, a difference of 0.010%).
| Demographics | Rating | Rank | Nursery School |
| Immigrants | Malaysia | 1.9 /100 | #236 | Tragic 97.7% |
| Immigrants | Western Asia | 1.9 /100 | #237 | Tragic 97.7% |
| Nigerians | 1.7 /100 | #238 | Tragic 97.7% |
| Immigrants | Eastern Asia | 1.6 /100 | #239 | Tragic 97.7% |
| Koreans | 1.4 /100 | #240 | Tragic 97.7% |
| Immigrants | Indonesia | 1.1 /100 | #241 | Tragic 97.7% |
| Liberians | 1.1 /100 | #242 | Tragic 97.7% |
| Asians | 1.1 /100 | #243 | Tragic 97.6% |
| South Americans | 1.0 /100 | #244 | Tragic 97.6% |
| Bolivians | 1.0 /100 | #245 | Tragic 97.6% |
| Peruvians | 1.0 /100 | #246 | Tragic 97.6% |
| Immigrants | Middle Africa | 0.9 /100 | #247 | Tragic 97.6% |
| Indians (Asian) | 0.9 /100 | #248 | Tragic 97.6% |
| Immigrants | Eastern Africa | 0.9 /100 | #249 | Tragic 97.6% |
| Immigrants | Senegal | 0.9 /100 | #250 | Tragic 97.6% |