Immigrants from Australia vs Panamanian 8th Grade
COMPARE
Immigrants from Australia
Panamanian
8th Grade
8th Grade Comparison
Immigrants from Australia
Panamanians
96.5%
8TH GRADE
99.0/ 100
METRIC RATING
87th/ 347
METRIC RANK
95.6%
8TH GRADE
28.4/ 100
METRIC RATING
193rd/ 347
METRIC RANK
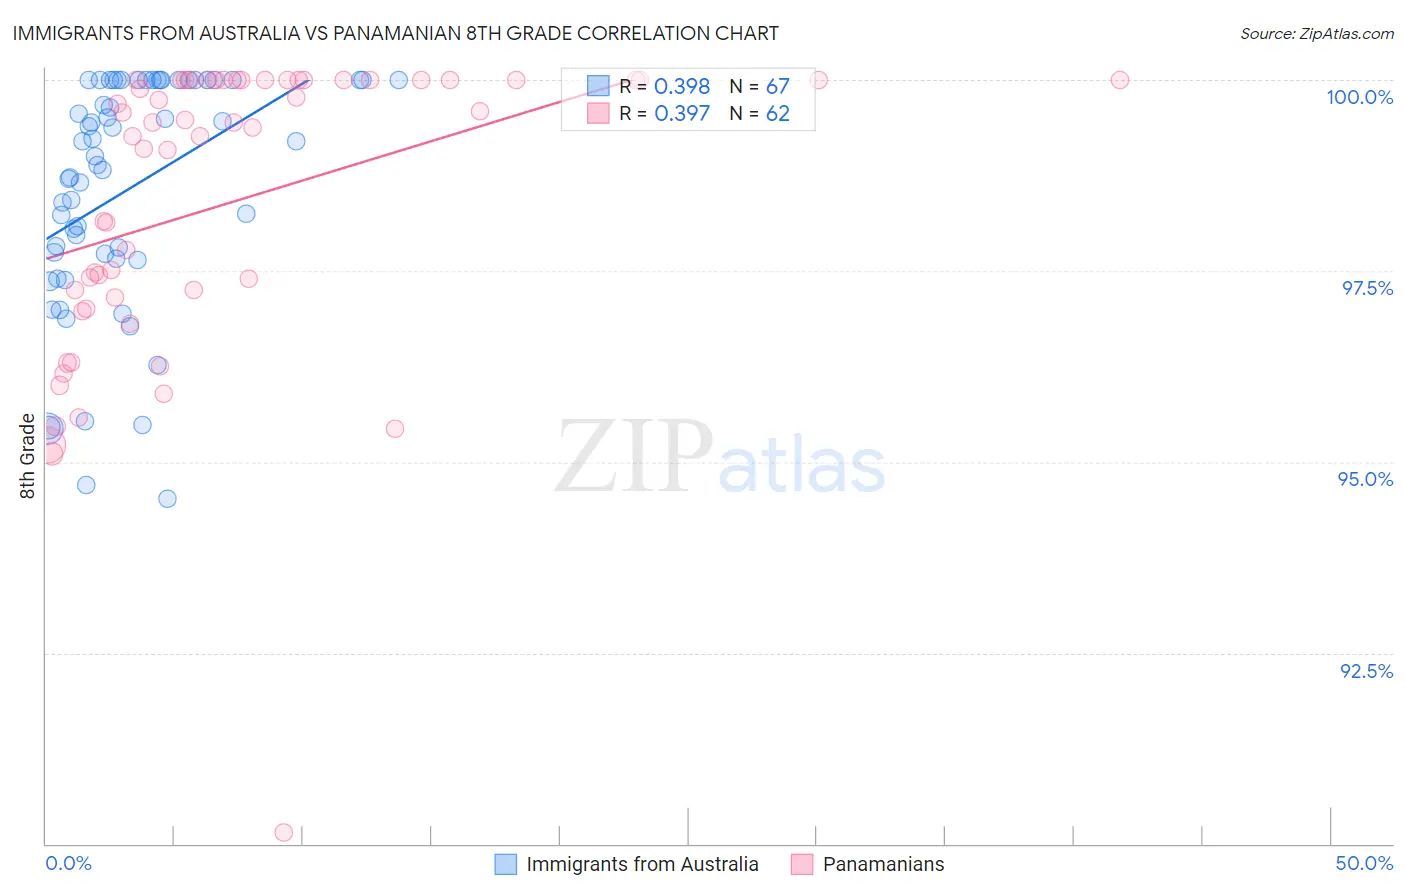
Immigrants from Australia vs Panamanian 8th Grade Correlation Chart
The statistical analysis conducted on geographies consisting of 227,203,192 people shows a mild positive correlation between the proportion of Immigrants from Australia and percentage of population with at least 8th grade education in the United States with a correlation coefficient (R) of 0.398 and weighted average of 96.5%. Similarly, the statistical analysis conducted on geographies consisting of 281,248,945 people shows a mild positive correlation between the proportion of Panamanians and percentage of population with at least 8th grade education in the United States with a correlation coefficient (R) of 0.397 and weighted average of 95.6%, a difference of 0.90%.
8th Grade Correlation Summary
| Measurement | Immigrants from Australia | Panamanian |
| Minimum | 94.5% | 90.1% |
| Maximum | 100.0% | 100.0% |
| Range | 5.5% | 9.9% |
| Mean | 98.6% | 98.4% |
| Median | 99.0% | 99.4% |
| Interquartile 25% (IQ1) | 97.7% | 97.2% |
| Interquartile 75% (IQ3) | 100.0% | 100.0% |
| Interquartile Range (IQR) | 2.3% | 2.8% |
| Standard Deviation (Sample) | 1.5% | 2.0% |
| Standard Deviation (Population) | 1.5% | 1.9% |
Similar Demographics by 8th Grade
Demographics Similar to Immigrants from Australia by 8th Grade
In terms of 8th grade, the demographic groups most similar to Immigrants from Australia are Immigrants from South Africa (96.5%, a difference of 0.0%), Cherokee (96.5%, a difference of 0.0%), Immigrants from Western Europe (96.4%, a difference of 0.010%), Immigrants from Belgium (96.5%, a difference of 0.020%), and Chickasaw (96.4%, a difference of 0.020%).
| Demographics | Rating | Rank | 8th Grade |
| Delaware | 99.2 /100 | #80 | Exceptional 96.5% |
| Romanians | 99.2 /100 | #81 | Exceptional 96.5% |
| Turks | 99.2 /100 | #82 | Exceptional 96.5% |
| Icelanders | 99.2 /100 | #83 | Exceptional 96.5% |
| Immigrants | Belgium | 99.1 /100 | #84 | Exceptional 96.5% |
| Immigrants | South Africa | 99.1 /100 | #85 | Exceptional 96.5% |
| Cherokee | 99.0 /100 | #86 | Exceptional 96.5% |
| Immigrants | Australia | 99.0 /100 | #87 | Exceptional 96.5% |
| Immigrants | Western Europe | 99.0 /100 | #88 | Exceptional 96.4% |
| Chickasaw | 98.9 /100 | #89 | Exceptional 96.4% |
| Immigrants | Sweden | 98.9 /100 | #90 | Exceptional 96.4% |
| Thais | 98.9 /100 | #91 | Exceptional 96.4% |
| Menominee | 98.9 /100 | #92 | Exceptional 96.4% |
| Immigrants | Denmark | 98.8 /100 | #93 | Exceptional 96.4% |
| Immigrants | Singapore | 98.8 /100 | #94 | Exceptional 96.4% |
Demographics Similar to Panamanians by 8th Grade
In terms of 8th grade, the demographic groups most similar to Panamanians are Pima (95.6%, a difference of 0.0%), Immigrants from Nepal (95.6%, a difference of 0.010%), Guamanian/Chamorro (95.6%, a difference of 0.010%), Immigrants from Micronesia (95.6%, a difference of 0.020%), and Immigrants from Venezuela (95.6%, a difference of 0.020%).
| Demographics | Rating | Rank | 8th Grade |
| Brazilians | 34.8 /100 | #186 | Fair 95.6% |
| Sudanese | 33.0 /100 | #187 | Fair 95.6% |
| Liberians | 32.4 /100 | #188 | Fair 95.6% |
| Immigrants | Micronesia | 31.6 /100 | #189 | Fair 95.6% |
| Immigrants | Venezuela | 30.8 /100 | #190 | Fair 95.6% |
| Immigrants | Nepal | 30.2 /100 | #191 | Fair 95.6% |
| Pima | 28.6 /100 | #192 | Fair 95.6% |
| Panamanians | 28.4 /100 | #193 | Fair 95.6% |
| Guamanians/Chamorros | 26.6 /100 | #194 | Fair 95.6% |
| Immigrants | Zaire | 25.2 /100 | #195 | Fair 95.6% |
| Assyrians/Chaldeans/Syriacs | 24.5 /100 | #196 | Fair 95.6% |
| Sierra Leoneans | 24.3 /100 | #197 | Fair 95.6% |
| Paraguayans | 22.6 /100 | #198 | Fair 95.5% |
| Immigrants | Northern Africa | 22.5 /100 | #199 | Fair 95.5% |
| Argentineans | 22.2 /100 | #200 | Fair 95.5% |