Immigrants from Asia vs Immigrants from South America Bachelor's Degree
COMPARE
Immigrants from Asia
Immigrants from South America
Bachelor's Degree
Bachelor's Degree Comparison
Immigrants from Asia
Immigrants from South America
44.3%
BACHELOR'S DEGREE
99.9/ 100
METRIC RATING
53rd/ 347
METRIC RANK
38.6%
BACHELOR'S DEGREE
70.1/ 100
METRIC RATING
157th/ 347
METRIC RANK
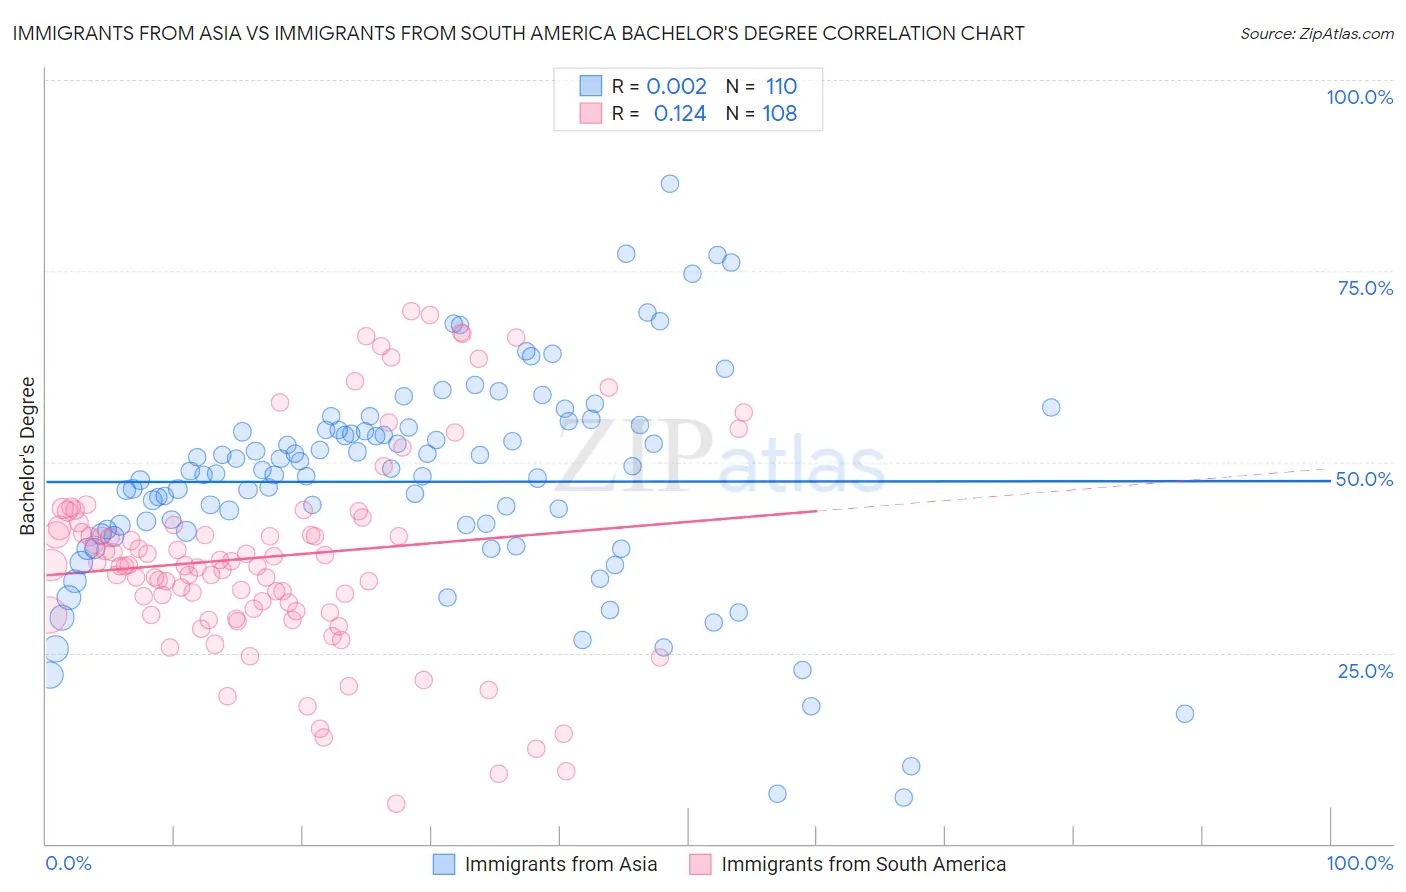
Immigrants from Asia vs Immigrants from South America Bachelor's Degree Correlation Chart
The statistical analysis conducted on geographies consisting of 549,058,309 people shows no correlation between the proportion of Immigrants from Asia and percentage of population with at least bachelor's degree education in the United States with a correlation coefficient (R) of 0.002 and weighted average of 44.3%. Similarly, the statistical analysis conducted on geographies consisting of 486,368,890 people shows a poor positive correlation between the proportion of Immigrants from South America and percentage of population with at least bachelor's degree education in the United States with a correlation coefficient (R) of 0.124 and weighted average of 38.6%, a difference of 14.7%.
Bachelor's Degree Correlation Summary
| Measurement | Immigrants from Asia | Immigrants from South America |
| Minimum | 6.0% | 5.3% |
| Maximum | 86.4% | 69.7% |
| Range | 80.4% | 64.4% |
| Mean | 47.4% | 37.6% |
| Median | 48.6% | 36.4% |
| Interquartile 25% (IQ1) | 40.9% | 30.4% |
| Interquartile 75% (IQ3) | 54.2% | 41.9% |
| Interquartile Range (IQR) | 13.3% | 11.5% |
| Standard Deviation (Sample) | 14.2% | 13.4% |
| Standard Deviation (Population) | 14.1% | 13.4% |
Similar Demographics by Bachelor's Degree
Demographics Similar to Immigrants from Asia by Bachelor's Degree
In terms of bachelor's degree, the demographic groups most similar to Immigrants from Asia are Immigrants from Spain (44.3%, a difference of 0.060%), Immigrants from Austria (44.2%, a difference of 0.19%), Immigrants from Bolivia (44.2%, a difference of 0.19%), Asian (44.4%, a difference of 0.24%), and Immigrants from Serbia (44.1%, a difference of 0.37%).
| Demographics | Rating | Rank | Bachelor's Degree |
| Immigrants | Bulgaria | 99.9 /100 | #46 | Exceptional 44.6% |
| Bolivians | 99.9 /100 | #47 | Exceptional 44.6% |
| Estonians | 99.9 /100 | #48 | Exceptional 44.6% |
| Immigrants | Norway | 99.9 /100 | #49 | Exceptional 44.5% |
| Immigrants | Greece | 99.9 /100 | #50 | Exceptional 44.5% |
| Asians | 99.9 /100 | #51 | Exceptional 44.4% |
| Immigrants | Spain | 99.9 /100 | #52 | Exceptional 44.3% |
| Immigrants | Asia | 99.9 /100 | #53 | Exceptional 44.3% |
| Immigrants | Austria | 99.9 /100 | #54 | Exceptional 44.2% |
| Immigrants | Bolivia | 99.9 /100 | #55 | Exceptional 44.2% |
| Immigrants | Serbia | 99.9 /100 | #56 | Exceptional 44.1% |
| Paraguayans | 99.9 /100 | #57 | Exceptional 44.0% |
| Immigrants | Czechoslovakia | 99.9 /100 | #58 | Exceptional 44.0% |
| Australians | 99.9 /100 | #59 | Exceptional 44.0% |
| New Zealanders | 99.9 /100 | #60 | Exceptional 44.0% |
Demographics Similar to Immigrants from South America by Bachelor's Degree
In terms of bachelor's degree, the demographic groups most similar to Immigrants from South America are Immigrants from Germany (38.6%, a difference of 0.060%), Kenyan (38.7%, a difference of 0.28%), Chinese (38.5%, a difference of 0.39%), Vietnamese (38.5%, a difference of 0.39%), and Immigrants from Kenya (38.8%, a difference of 0.43%).
| Demographics | Rating | Rank | Bachelor's Degree |
| South Americans | 77.3 /100 | #150 | Good 38.9% |
| Immigrants | Africa | 76.5 /100 | #151 | Good 38.9% |
| Sudanese | 76.4 /100 | #152 | Good 38.9% |
| Slavs | 75.9 /100 | #153 | Good 38.9% |
| Canadians | 75.0 /100 | #154 | Good 38.8% |
| Immigrants | Kenya | 73.8 /100 | #155 | Good 38.8% |
| Kenyans | 72.5 /100 | #156 | Good 38.7% |
| Immigrants | South America | 70.1 /100 | #157 | Good 38.6% |
| Immigrants | Germany | 69.6 /100 | #158 | Good 38.6% |
| Chinese | 66.6 /100 | #159 | Good 38.5% |
| Vietnamese | 66.6 /100 | #160 | Good 38.5% |
| Uruguayans | 65.8 /100 | #161 | Good 38.4% |
| Colombians | 65.0 /100 | #162 | Good 38.4% |
| Peruvians | 63.4 /100 | #163 | Good 38.3% |
| Hungarians | 62.1 /100 | #164 | Good 38.3% |