Immigrants from Armenia vs Immigrants from Latvia 3rd Grade
COMPARE
Immigrants from Armenia
Immigrants from Latvia
3rd Grade
3rd Grade Comparison
Immigrants from Armenia
Immigrants from Latvia
96.3%
3RD GRADE
0.0/ 100
METRIC RATING
330th/ 347
METRIC RANK
98.0%
3RD GRADE
96.0/ 100
METRIC RATING
112th/ 347
METRIC RANK
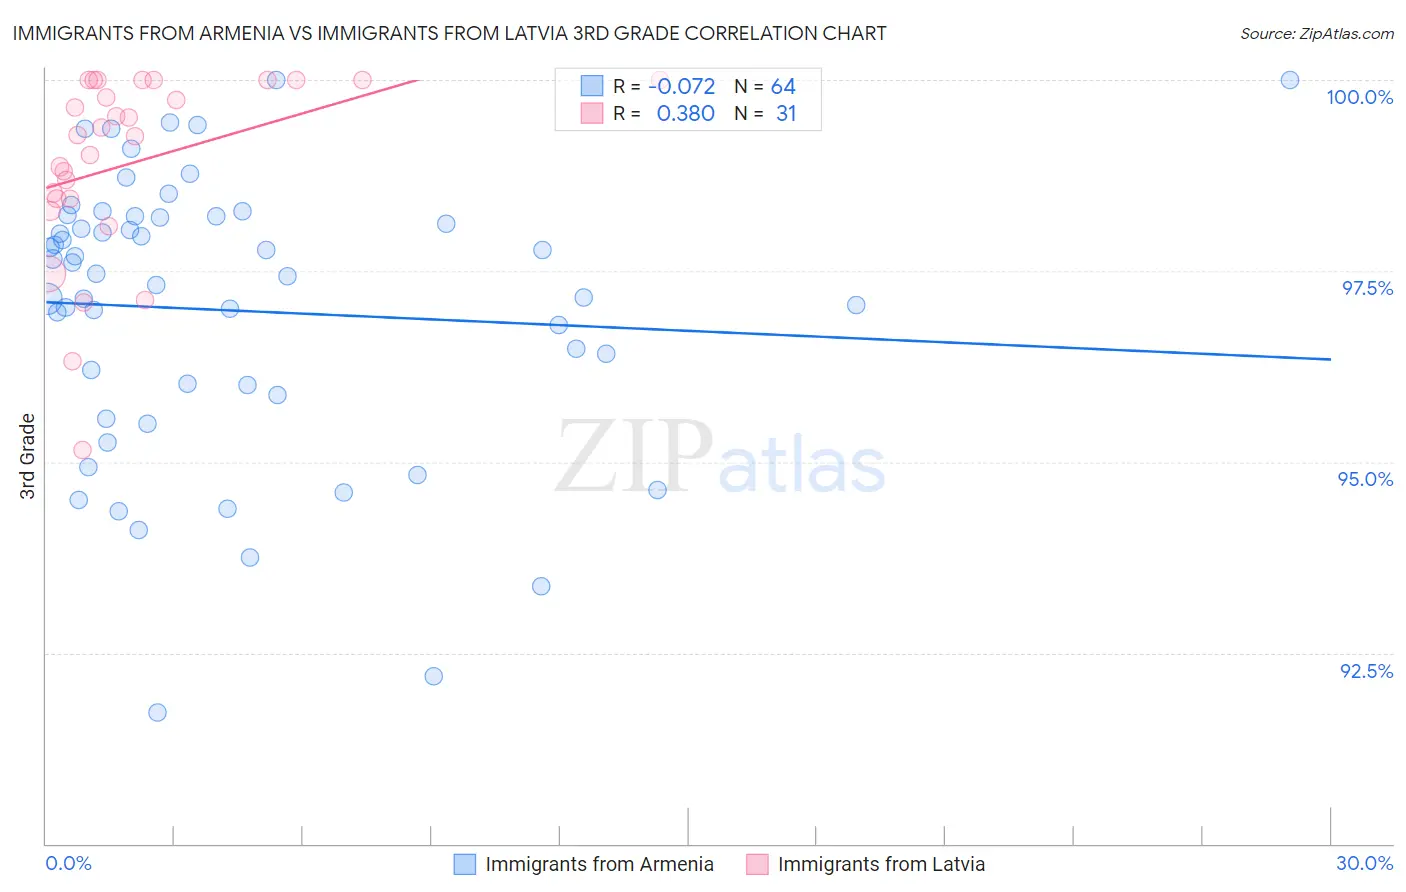
Immigrants from Armenia vs Immigrants from Latvia 3rd Grade Correlation Chart
The statistical analysis conducted on geographies consisting of 97,725,276 people shows a slight negative correlation between the proportion of Immigrants from Armenia and percentage of population with at least 3rd grade education in the United States with a correlation coefficient (R) of -0.072 and weighted average of 96.3%. Similarly, the statistical analysis conducted on geographies consisting of 113,735,345 people shows a mild positive correlation between the proportion of Immigrants from Latvia and percentage of population with at least 3rd grade education in the United States with a correlation coefficient (R) of 0.380 and weighted average of 98.0%, a difference of 1.8%.
3rd Grade Correlation Summary
| Measurement | Immigrants from Armenia | Immigrants from Latvia |
| Minimum | 91.7% | 95.2% |
| Maximum | 100.0% | 100.0% |
| Range | 8.3% | 4.8% |
| Mean | 97.0% | 98.9% |
| Median | 97.5% | 99.3% |
| Interquartile 25% (IQ1) | 95.9% | 98.4% |
| Interquartile 75% (IQ3) | 98.2% | 100.0% |
| Interquartile Range (IQR) | 2.3% | 1.6% |
| Standard Deviation (Sample) | 1.8% | 1.2% |
| Standard Deviation (Population) | 1.8% | 1.2% |
Similar Demographics by 3rd Grade
Demographics Similar to Immigrants from Armenia by 3rd Grade
In terms of 3rd grade, the demographic groups most similar to Immigrants from Armenia are Immigrants from Latin America (96.2%, a difference of 0.010%), Mexican (96.2%, a difference of 0.020%), Immigrants from Fiji (96.2%, a difference of 0.050%), Immigrants from Cambodia (96.2%, a difference of 0.070%), and Immigrants from Dominican Republic (96.2%, a difference of 0.070%).
| Demographics | Rating | Rank | 3rd Grade |
| Hondurans | 0.0 /100 | #323 | Tragic 96.5% |
| Dominicans | 0.0 /100 | #324 | Tragic 96.4% |
| Mexican American Indians | 0.0 /100 | #325 | Tragic 96.4% |
| Immigrants | Vietnam | 0.0 /100 | #326 | Tragic 96.4% |
| Japanese | 0.0 /100 | #327 | Tragic 96.4% |
| Bangladeshis | 0.0 /100 | #328 | Tragic 96.3% |
| Immigrants | Honduras | 0.0 /100 | #329 | Tragic 96.3% |
| Immigrants | Armenia | 0.0 /100 | #330 | Tragic 96.3% |
| Immigrants | Latin America | 0.0 /100 | #331 | Tragic 96.2% |
| Mexicans | 0.0 /100 | #332 | Tragic 96.2% |
| Immigrants | Fiji | 0.0 /100 | #333 | Tragic 96.2% |
| Immigrants | Cambodia | 0.0 /100 | #334 | Tragic 96.2% |
| Immigrants | Dominican Republic | 0.0 /100 | #335 | Tragic 96.2% |
| Immigrants | Cabo Verde | 0.0 /100 | #336 | Tragic 96.2% |
| Central Americans | 0.0 /100 | #337 | Tragic 96.1% |
Demographics Similar to Immigrants from Latvia by 3rd Grade
In terms of 3rd grade, the demographic groups most similar to Immigrants from Latvia are Basque (98.0%, a difference of 0.010%), Thai (98.0%, a difference of 0.010%), Menominee (98.0%, a difference of 0.010%), Immigrants from Czechoslovakia (98.0%, a difference of 0.020%), and Immigrants from Singapore (98.0%, a difference of 0.020%).
| Demographics | Rating | Rank | 3rd Grade |
| German Russians | 97.2 /100 | #105 | Exceptional 98.1% |
| Bhutanese | 97.2 /100 | #106 | Exceptional 98.1% |
| Immigrants | Czechoslovakia | 97.0 /100 | #107 | Exceptional 98.0% |
| Immigrants | Singapore | 96.7 /100 | #108 | Exceptional 98.0% |
| Pima | 96.7 /100 | #109 | Exceptional 98.0% |
| Immigrants | Switzerland | 96.6 /100 | #110 | Exceptional 98.0% |
| Basques | 96.5 /100 | #111 | Exceptional 98.0% |
| Immigrants | Latvia | 96.0 /100 | #112 | Exceptional 98.0% |
| Thais | 95.5 /100 | #113 | Exceptional 98.0% |
| Menominee | 95.4 /100 | #114 | Exceptional 98.0% |
| Okinawans | 95.2 /100 | #115 | Exceptional 98.0% |
| Immigrants | Norway | 95.2 /100 | #116 | Exceptional 98.0% |
| Immigrants | France | 95.1 /100 | #117 | Exceptional 98.0% |
| Iranians | 94.9 /100 | #118 | Exceptional 98.0% |
| Spanish | 94.8 /100 | #119 | Exceptional 98.0% |