Immigrants from Argentina vs Lebanese 1st Grade
COMPARE
Immigrants from Argentina
Lebanese
1st Grade
1st Grade Comparison
Immigrants from Argentina
Lebanese
97.9%
1ST GRADE
41.3/ 100
METRIC RATING
183rd/ 347
METRIC RANK
98.1%
1ST GRADE
93.5/ 100
METRIC RATING
126th/ 347
METRIC RANK
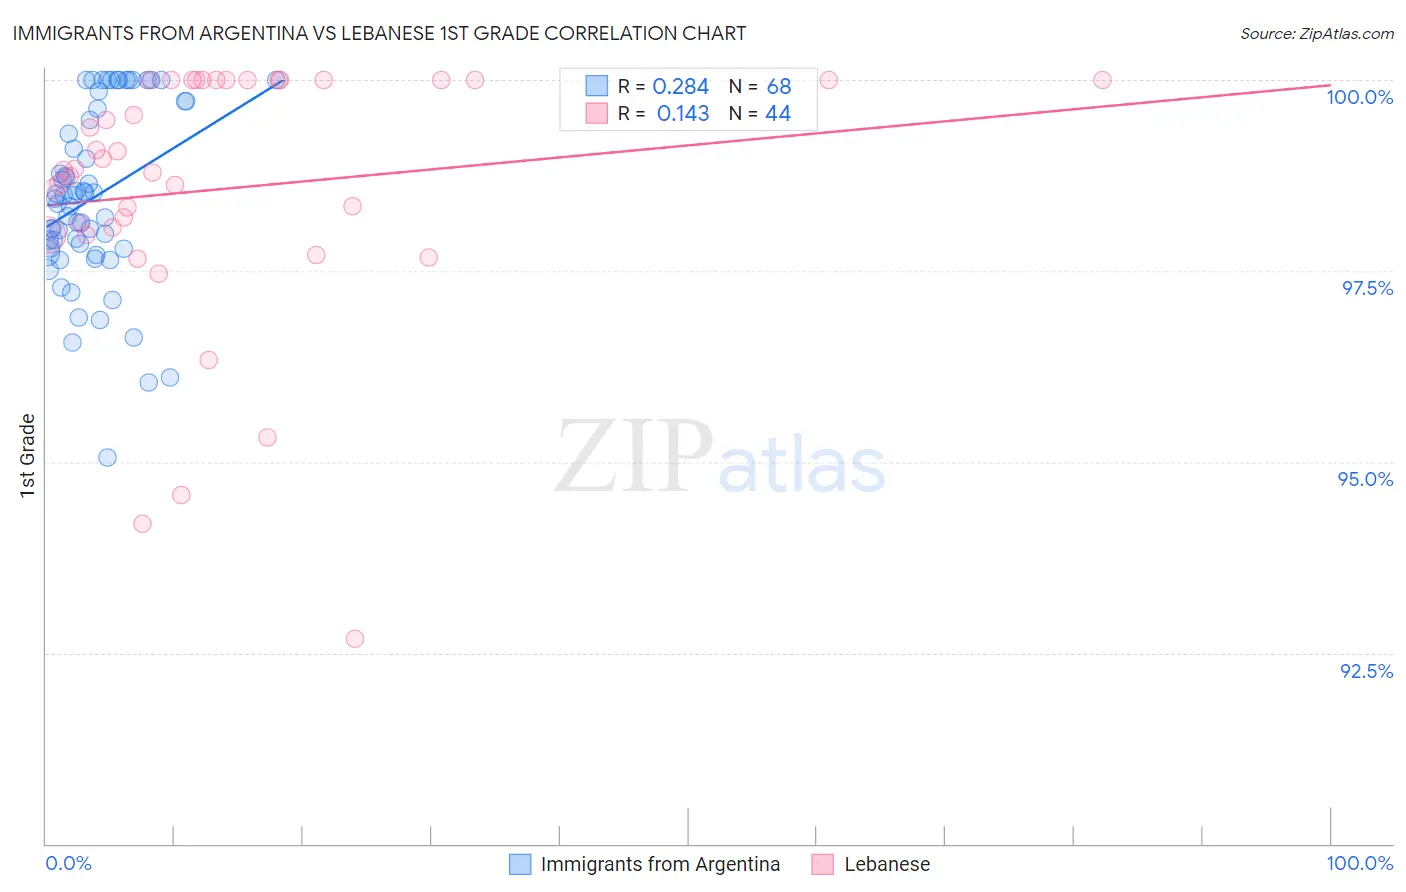
Immigrants from Argentina vs Lebanese 1st Grade Correlation Chart
The statistical analysis conducted on geographies consisting of 264,435,492 people shows a weak positive correlation between the proportion of Immigrants from Argentina and percentage of population with at least 1st grade education in the United States with a correlation coefficient (R) of 0.284 and weighted average of 97.9%. Similarly, the statistical analysis conducted on geographies consisting of 401,624,157 people shows a poor positive correlation between the proportion of Lebanese and percentage of population with at least 1st grade education in the United States with a correlation coefficient (R) of 0.143 and weighted average of 98.1%, a difference of 0.24%.
1st Grade Correlation Summary
| Measurement | Immigrants from Argentina | Lebanese |
| Minimum | 95.1% | 92.7% |
| Maximum | 100.0% | 100.0% |
| Range | 4.9% | 7.3% |
| Mean | 98.5% | 98.6% |
| Median | 98.5% | 98.8% |
| Interquartile 25% (IQ1) | 97.8% | 98.0% |
| Interquartile 75% (IQ3) | 99.7% | 100.0% |
| Interquartile Range (IQR) | 1.9% | 2.0% |
| Standard Deviation (Sample) | 1.2% | 1.7% |
| Standard Deviation (Population) | 1.1% | 1.7% |
Similar Demographics by 1st Grade
Demographics Similar to Immigrants from Argentina by 1st Grade
In terms of 1st grade, the demographic groups most similar to Immigrants from Argentina are Egyptian (97.9%, a difference of 0.0%), Immigrants from Poland (97.9%, a difference of 0.0%), Portuguese (97.9%, a difference of 0.010%), Immigrants from Belarus (97.9%, a difference of 0.010%), and Immigrants from Brazil (97.9%, a difference of 0.020%).
| Demographics | Rating | Rank | 1st Grade |
| Albanians | 49.6 /100 | #176 | Average 97.9% |
| Immigrants | Brazil | 49.1 /100 | #177 | Average 97.9% |
| Immigrants | Venezuela | 47.8 /100 | #178 | Average 97.9% |
| Argentineans | 47.2 /100 | #179 | Average 97.9% |
| Immigrants | Bosnia and Herzegovina | 46.6 /100 | #180 | Average 97.9% |
| Portuguese | 44.2 /100 | #181 | Average 97.9% |
| Egyptians | 42.7 /100 | #182 | Average 97.9% |
| Immigrants | Argentina | 41.3 /100 | #183 | Average 97.9% |
| Immigrants | Poland | 40.1 /100 | #184 | Average 97.9% |
| Immigrants | Belarus | 39.3 /100 | #185 | Fair 97.9% |
| Paiute | 36.5 /100 | #186 | Fair 97.9% |
| Pakistanis | 35.8 /100 | #187 | Fair 97.9% |
| Arabs | 35.5 /100 | #188 | Fair 97.9% |
| Immigrants | Kazakhstan | 34.9 /100 | #189 | Fair 97.9% |
| Panamanians | 34.1 /100 | #190 | Fair 97.9% |
Demographics Similar to Lebanese by 1st Grade
In terms of 1st grade, the demographic groups most similar to Lebanese are Iroquois (98.1%, a difference of 0.0%), Syrian (98.1%, a difference of 0.0%), Immigrants from Japan (98.1%, a difference of 0.0%), Immigrants from Saudi Arabia (98.1%, a difference of 0.0%), and Okinawan (98.1%, a difference of 0.010%).
| Demographics | Rating | Rank | 1st Grade |
| Thais | 94.7 /100 | #119 | Exceptional 98.1% |
| Okinawans | 94.5 /100 | #120 | Exceptional 98.1% |
| Immigrants | Zimbabwe | 94.0 /100 | #121 | Exceptional 98.1% |
| Menominee | 93.9 /100 | #122 | Exceptional 98.1% |
| Iroquois | 93.8 /100 | #123 | Exceptional 98.1% |
| Syrians | 93.7 /100 | #124 | Exceptional 98.1% |
| Immigrants | Japan | 93.7 /100 | #125 | Exceptional 98.1% |
| Lebanese | 93.5 /100 | #126 | Exceptional 98.1% |
| Immigrants | Saudi Arabia | 93.3 /100 | #127 | Exceptional 98.1% |
| Immigrants | Serbia | 92.2 /100 | #128 | Exceptional 98.1% |
| Seminole | 91.9 /100 | #129 | Exceptional 98.1% |
| Immigrants | Croatia | 91.4 /100 | #130 | Exceptional 98.1% |
| Spaniards | 91.2 /100 | #131 | Exceptional 98.1% |
| Cambodians | 90.9 /100 | #132 | Exceptional 98.1% |
| Immigrants | Europe | 90.5 /100 | #133 | Exceptional 98.1% |