Immigrants from Albania vs Tohono O'odham 2nd Grade
COMPARE
Immigrants from Albania
Tohono O'odham
2nd Grade
2nd Grade Comparison
Immigrants from Albania
Tohono O'odham
97.8%
2ND GRADE
18.4/ 100
METRIC RATING
204th/ 347
METRIC RANK
97.8%
2ND GRADE
20.9/ 100
METRIC RATING
201st/ 347
METRIC RANK
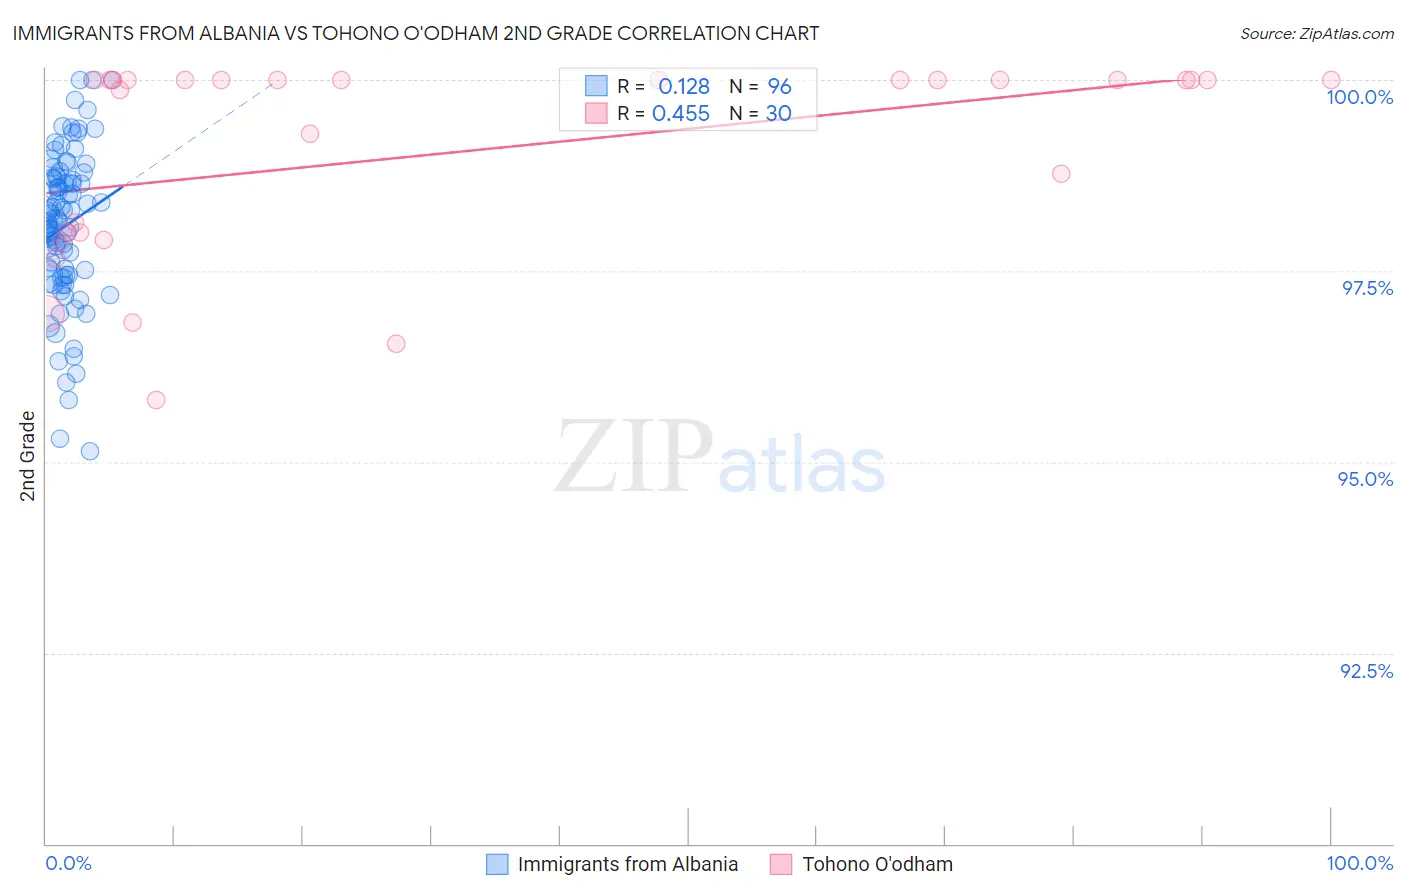
Immigrants from Albania vs Tohono O'odham 2nd Grade Correlation Chart
The statistical analysis conducted on geographies consisting of 119,263,578 people shows a poor positive correlation between the proportion of Immigrants from Albania and percentage of population with at least 2nd grade education in the United States with a correlation coefficient (R) of 0.128 and weighted average of 97.8%. Similarly, the statistical analysis conducted on geographies consisting of 58,723,100 people shows a moderate positive correlation between the proportion of Tohono O'odham and percentage of population with at least 2nd grade education in the United States with a correlation coefficient (R) of 0.455 and weighted average of 97.8%, a difference of 0.010%.
2nd Grade Correlation Summary
| Measurement | Immigrants from Albania | Tohono O'odham |
| Minimum | 95.1% | 95.8% |
| Maximum | 100.0% | 100.0% |
| Range | 4.9% | 4.2% |
| Mean | 98.1% | 99.1% |
| Median | 98.2% | 100.0% |
| Interquartile 25% (IQ1) | 97.4% | 98.0% |
| Interquartile 75% (IQ3) | 98.7% | 100.0% |
| Interquartile Range (IQR) | 1.3% | 2.0% |
| Standard Deviation (Sample) | 1.00% | 1.3% |
| Standard Deviation (Population) | 0.99% | 1.3% |
Demographics Similar to Immigrants from Albania and Tohono O'odham by 2nd Grade
In terms of 2nd grade, the demographic groups most similar to Immigrants from Albania are Immigrants from Southern Europe (97.8%, a difference of 0.0%), Immigrants from Lebanon (97.8%, a difference of 0.010%), Immigrants from Ukraine (97.8%, a difference of 0.010%), Yuman (97.8%, a difference of 0.010%), and Immigrants from Chile (97.7%, a difference of 0.010%). Similarly, the demographic groups most similar to Tohono O'odham are Immigrants from Lebanon (97.8%, a difference of 0.0%), Immigrants from Ukraine (97.8%, a difference of 0.0%), Yuman (97.8%, a difference of 0.0%), Immigrants from Southern Europe (97.8%, a difference of 0.010%), and Immigrants from Kenya (97.8%, a difference of 0.020%).
| Demographics | Rating | Rank | 2nd Grade |
| Blacks/African Americans | 29.9 /100 | #192 | Fair 97.8% |
| Hawaiians | 28.5 /100 | #193 | Fair 97.8% |
| Paiute | 27.0 /100 | #194 | Fair 97.8% |
| Mongolians | 26.7 /100 | #195 | Fair 97.8% |
| Immigrants | Kenya | 26.4 /100 | #196 | Fair 97.8% |
| Immigrants | Uganda | 26.3 /100 | #197 | Fair 97.8% |
| Guamanians/Chamorros | 25.7 /100 | #198 | Fair 97.8% |
| Immigrants | Egypt | 24.4 /100 | #199 | Fair 97.8% |
| Immigrants | Lebanon | 20.9 /100 | #200 | Fair 97.8% |
| Tohono O'odham | 20.9 /100 | #201 | Fair 97.8% |
| Immigrants | Ukraine | 20.5 /100 | #202 | Fair 97.8% |
| Yuman | 20.0 /100 | #203 | Fair 97.8% |
| Immigrants | Albania | 18.4 /100 | #204 | Poor 97.8% |
| Immigrants | Southern Europe | 18.1 /100 | #205 | Poor 97.8% |
| Immigrants | Chile | 17.3 /100 | #206 | Poor 97.7% |
| Africans | 15.6 /100 | #207 | Poor 97.7% |
| Immigrants | Northern Africa | 12.3 /100 | #208 | Poor 97.7% |
| Immigrants | Oceania | 10.9 /100 | #209 | Poor 97.7% |
| Costa Ricans | 10.5 /100 | #210 | Poor 97.7% |
| Laotians | 9.9 /100 | #211 | Tragic 97.7% |
| Immigrants | Bahamas | 8.4 /100 | #212 | Tragic 97.7% |