Immigrants from Albania vs Basque 1st Grade
COMPARE
Immigrants from Albania
Basque
1st Grade
1st Grade Comparison
Immigrants from Albania
Basques
97.8%
1ST GRADE
17.3/ 100
METRIC RATING
206th/ 347
METRIC RANK
98.2%
1ST GRADE
97.4/ 100
METRIC RATING
105th/ 347
METRIC RANK
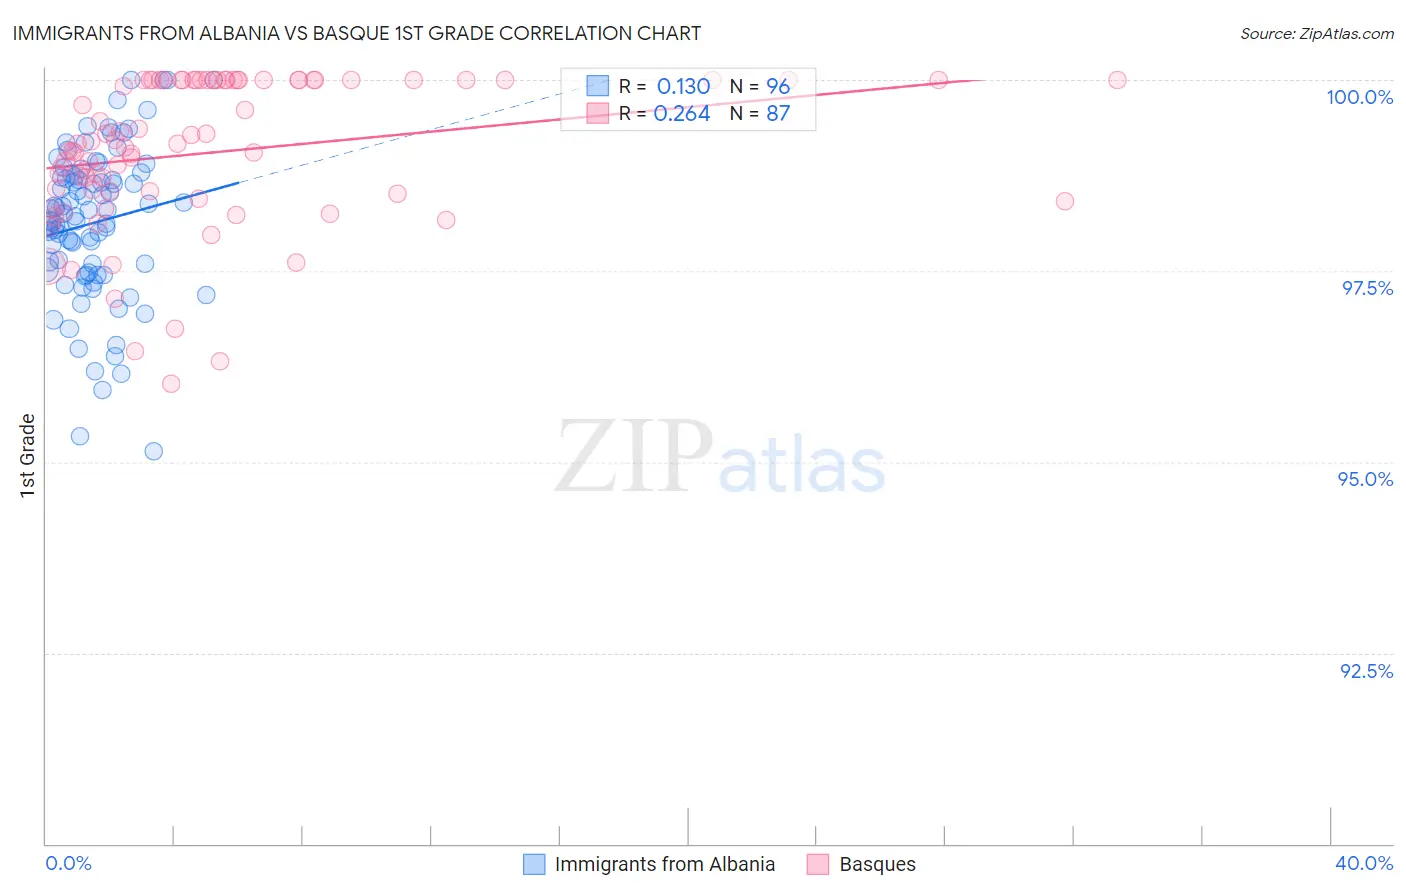
Immigrants from Albania vs Basque 1st Grade Correlation Chart
The statistical analysis conducted on geographies consisting of 119,263,578 people shows a poor positive correlation between the proportion of Immigrants from Albania and percentage of population with at least 1st grade education in the United States with a correlation coefficient (R) of 0.130 and weighted average of 97.8%. Similarly, the statistical analysis conducted on geographies consisting of 165,774,137 people shows a weak positive correlation between the proportion of Basques and percentage of population with at least 1st grade education in the United States with a correlation coefficient (R) of 0.264 and weighted average of 98.2%, a difference of 0.40%.
1st Grade Correlation Summary
| Measurement | Immigrants from Albania | Basque |
| Minimum | 95.1% | 96.0% |
| Maximum | 100.0% | 100.0% |
| Range | 4.9% | 4.0% |
| Mean | 98.1% | 99.1% |
| Median | 98.2% | 99.2% |
| Interquartile 25% (IQ1) | 97.5% | 98.5% |
| Interquartile 75% (IQ3) | 98.7% | 100.0% |
| Interquartile Range (IQR) | 1.2% | 1.5% |
| Standard Deviation (Sample) | 0.99% | 0.97% |
| Standard Deviation (Population) | 0.98% | 0.97% |
Similar Demographics by 1st Grade
Demographics Similar to Immigrants from Albania by 1st Grade
In terms of 1st grade, the demographic groups most similar to Immigrants from Albania are Immigrants from Uganda (97.8%, a difference of 0.0%), Immigrants from Chile (97.8%, a difference of 0.0%), African (97.8%, a difference of 0.0%), Immigrants from Lebanon (97.8%, a difference of 0.010%), and Immigrants from Ukraine (97.8%, a difference of 0.010%).
| Demographics | Rating | Rank | 1st Grade |
| Tohono O'odham | 23.2 /100 | #199 | Fair 97.8% |
| Immigrants | Egypt | 22.6 /100 | #200 | Fair 97.8% |
| Immigrants | Lebanon | 20.1 /100 | #201 | Fair 97.8% |
| Immigrants | Ukraine | 19.2 /100 | #202 | Poor 97.8% |
| Immigrants | Southern Europe | 18.2 /100 | #203 | Poor 97.8% |
| Immigrants | Uganda | 18.2 /100 | #204 | Poor 97.8% |
| Immigrants | Chile | 17.7 /100 | #205 | Poor 97.8% |
| Immigrants | Albania | 17.3 /100 | #206 | Poor 97.8% |
| Africans | 16.5 /100 | #207 | Poor 97.8% |
| Immigrants | Northern Africa | 12.0 /100 | #208 | Poor 97.8% |
| Costa Ricans | 11.6 /100 | #209 | Poor 97.8% |
| Immigrants | Oceania | 11.0 /100 | #210 | Poor 97.8% |
| Laotians | 10.3 /100 | #211 | Poor 97.8% |
| Moroccans | 8.7 /100 | #212 | Tragic 97.7% |
| Immigrants | Bahamas | 8.1 /100 | #213 | Tragic 97.7% |
Demographics Similar to Basques by 1st Grade
In terms of 1st grade, the demographic groups most similar to Basques are Pima (98.2%, a difference of 0.0%), Turkish (98.2%, a difference of 0.0%), Immigrants from Switzerland (98.2%, a difference of 0.0%), Bhutanese (98.2%, a difference of 0.0%), and Romanian (98.2%, a difference of 0.010%).
| Demographics | Rating | Rank | 1st Grade |
| Choctaw | 98.3 /100 | #98 | Exceptional 98.2% |
| Puget Sound Salish | 98.2 /100 | #99 | Exceptional 98.2% |
| Colville | 98.0 /100 | #100 | Exceptional 98.2% |
| Romanians | 97.8 /100 | #101 | Exceptional 98.2% |
| Cree | 97.8 /100 | #102 | Exceptional 98.2% |
| Immigrants | Ireland | 97.7 /100 | #103 | Exceptional 98.2% |
| Pima | 97.5 /100 | #104 | Exceptional 98.2% |
| Basques | 97.4 /100 | #105 | Exceptional 98.2% |
| Turks | 97.4 /100 | #106 | Exceptional 98.2% |
| Immigrants | Switzerland | 97.3 /100 | #107 | Exceptional 98.2% |
| Bhutanese | 97.3 /100 | #108 | Exceptional 98.2% |
| German Russians | 97.1 /100 | #109 | Exceptional 98.2% |
| Immigrants | Singapore | 96.7 /100 | #110 | Exceptional 98.2% |
| Immigrants | Czechoslovakia | 96.6 /100 | #111 | Exceptional 98.2% |
| Immigrants | Norway | 96.6 /100 | #112 | Exceptional 98.2% |