Immigrants from Africa vs Panamanian 5th Grade
COMPARE
Immigrants from Africa
Panamanian
5th Grade
5th Grade Comparison
Immigrants from Africa
Panamanians
96.9%
5TH GRADE
1.1/ 100
METRIC RATING
247th/ 347
METRIC RANK
97.3%
5TH GRADE
31.3/ 100
METRIC RATING
192nd/ 347
METRIC RANK
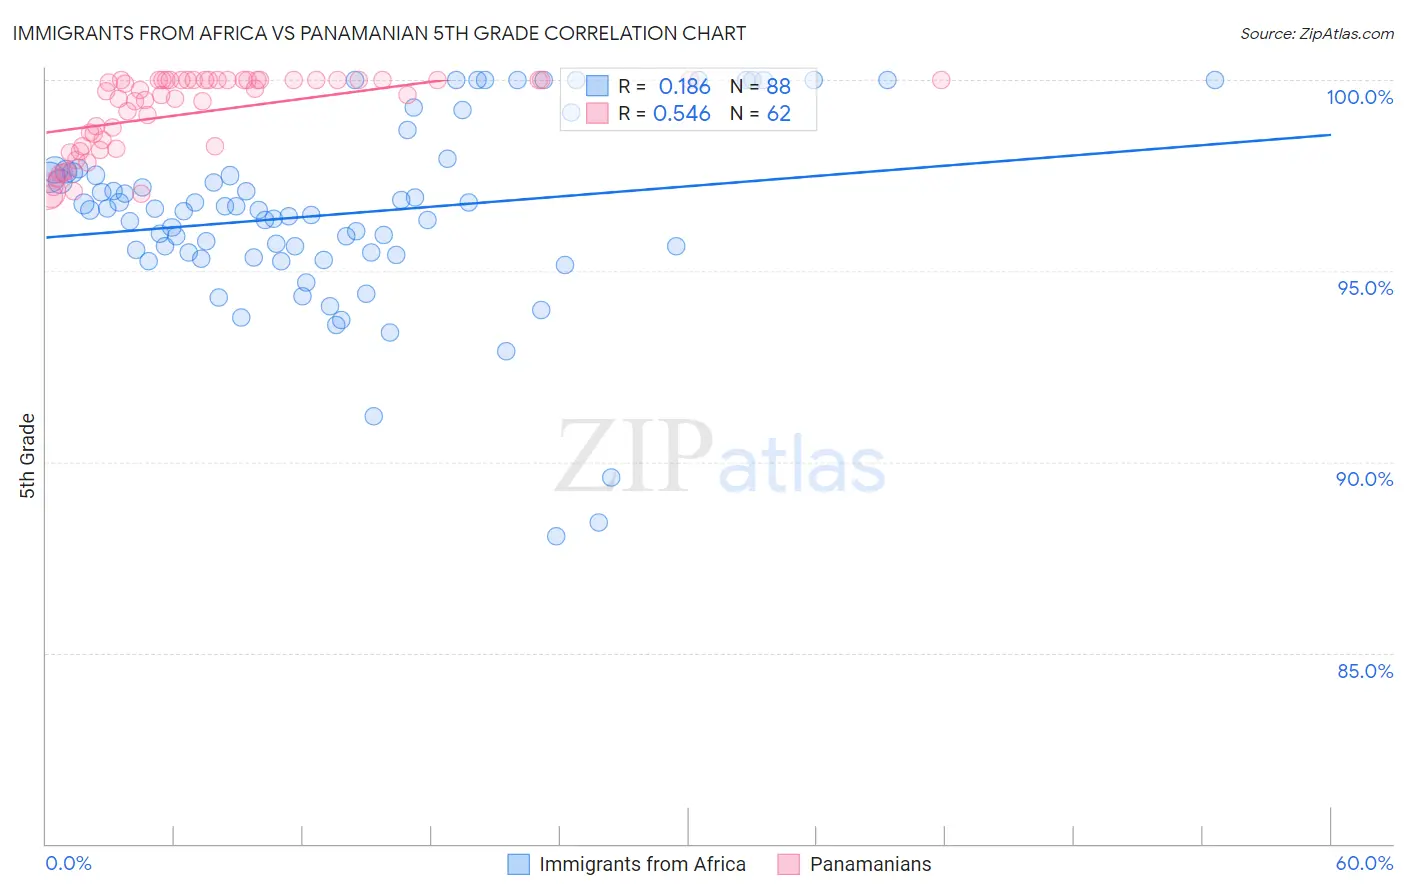
Immigrants from Africa vs Panamanian 5th Grade Correlation Chart
The statistical analysis conducted on geographies consisting of 469,408,495 people shows a poor positive correlation between the proportion of Immigrants from Africa and percentage of population with at least 5th grade education in the United States with a correlation coefficient (R) of 0.186 and weighted average of 96.9%. Similarly, the statistical analysis conducted on geographies consisting of 281,248,945 people shows a substantial positive correlation between the proportion of Panamanians and percentage of population with at least 5th grade education in the United States with a correlation coefficient (R) of 0.546 and weighted average of 97.3%, a difference of 0.39%.
5th Grade Correlation Summary
| Measurement | Immigrants from Africa | Panamanian |
| Minimum | 88.1% | 97.0% |
| Maximum | 100.0% | 100.0% |
| Range | 11.9% | 3.0% |
| Mean | 96.5% | 99.2% |
| Median | 96.6% | 99.6% |
| Interquartile 25% (IQ1) | 95.4% | 98.3% |
| Interquartile 75% (IQ3) | 97.6% | 100.0% |
| Interquartile Range (IQR) | 2.1% | 1.7% |
| Standard Deviation (Sample) | 2.4% | 1.0% |
| Standard Deviation (Population) | 2.4% | 1.0% |
Similar Demographics by 5th Grade
Demographics Similar to Immigrants from Africa by 5th Grade
In terms of 5th grade, the demographic groups most similar to Immigrants from Africa are U.S. Virgin Islander (96.9%, a difference of 0.0%), Ethiopian (96.9%, a difference of 0.010%), Immigrants from Uruguay (96.9%, a difference of 0.010%), Immigrants from Liberia (96.9%, a difference of 0.010%), and Bolivian (96.9%, a difference of 0.010%).
| Demographics | Rating | Rank | 5th Grade |
| Indians (Asian) | 1.9 /100 | #240 | Tragic 96.9% |
| Immigrants | Asia | 1.7 /100 | #241 | Tragic 96.9% |
| Immigrants | Costa Rica | 1.6 /100 | #242 | Tragic 96.9% |
| Immigrants | Eastern Africa | 1.6 /100 | #243 | Tragic 96.9% |
| Koreans | 1.6 /100 | #244 | Tragic 96.9% |
| Colombians | 1.3 /100 | #245 | Tragic 96.9% |
| Ethiopians | 1.2 /100 | #246 | Tragic 96.9% |
| Immigrants | Africa | 1.1 /100 | #247 | Tragic 96.9% |
| U.S. Virgin Islanders | 1.1 /100 | #248 | Tragic 96.9% |
| Immigrants | Uruguay | 1.0 /100 | #249 | Tragic 96.9% |
| Immigrants | Liberia | 1.0 /100 | #250 | Tragic 96.9% |
| Bolivians | 0.9 /100 | #251 | Tragic 96.9% |
| Jamaicans | 0.9 /100 | #252 | Tragic 96.9% |
| Immigrants | Middle Africa | 0.8 /100 | #253 | Tragic 96.8% |
| Immigrants | Senegal | 0.8 /100 | #254 | Tragic 96.8% |
Demographics Similar to Panamanians by 5th Grade
In terms of 5th grade, the demographic groups most similar to Panamanians are Black/African American (97.3%, a difference of 0.0%), Immigrants from Brazil (97.3%, a difference of 0.0%), Paraguayan (97.3%, a difference of 0.010%), Immigrants from Egypt (97.3%, a difference of 0.010%), and Navajo (97.2%, a difference of 0.010%).
| Demographics | Rating | Rank | 5th Grade |
| Dutch West Indians | 36.2 /100 | #185 | Fair 97.3% |
| Immigrants | Argentina | 36.1 /100 | #186 | Fair 97.3% |
| Spanish Americans | 34.7 /100 | #187 | Fair 97.3% |
| Paraguayans | 33.7 /100 | #188 | Fair 97.3% |
| Immigrants | Egypt | 32.9 /100 | #189 | Fair 97.3% |
| Blacks/African Americans | 31.8 /100 | #190 | Fair 97.3% |
| Immigrants | Brazil | 31.5 /100 | #191 | Fair 97.3% |
| Panamanians | 31.3 /100 | #192 | Fair 97.3% |
| Navajo | 29.0 /100 | #193 | Fair 97.2% |
| Immigrants | Albania | 28.5 /100 | #194 | Fair 97.2% |
| Guamanians/Chamorros | 26.8 /100 | #195 | Fair 97.2% |
| Hawaiians | 25.6 /100 | #196 | Fair 97.2% |
| Brazilians | 25.4 /100 | #197 | Fair 97.2% |
| Immigrants | Uganda | 21.1 /100 | #198 | Fair 97.2% |
| Natives/Alaskans | 18.0 /100 | #199 | Poor 97.2% |