Immigrants from Africa vs Immigrants from Ghana 3rd Grade
COMPARE
Immigrants from Africa
Immigrants from Ghana
3rd Grade
3rd Grade Comparison
Immigrants from Africa
Immigrants from Ghana
97.4%
3RD GRADE
0.8/ 100
METRIC RATING
253rd/ 347
METRIC RANK
97.2%
3RD GRADE
0.1/ 100
METRIC RATING
280th/ 347
METRIC RANK
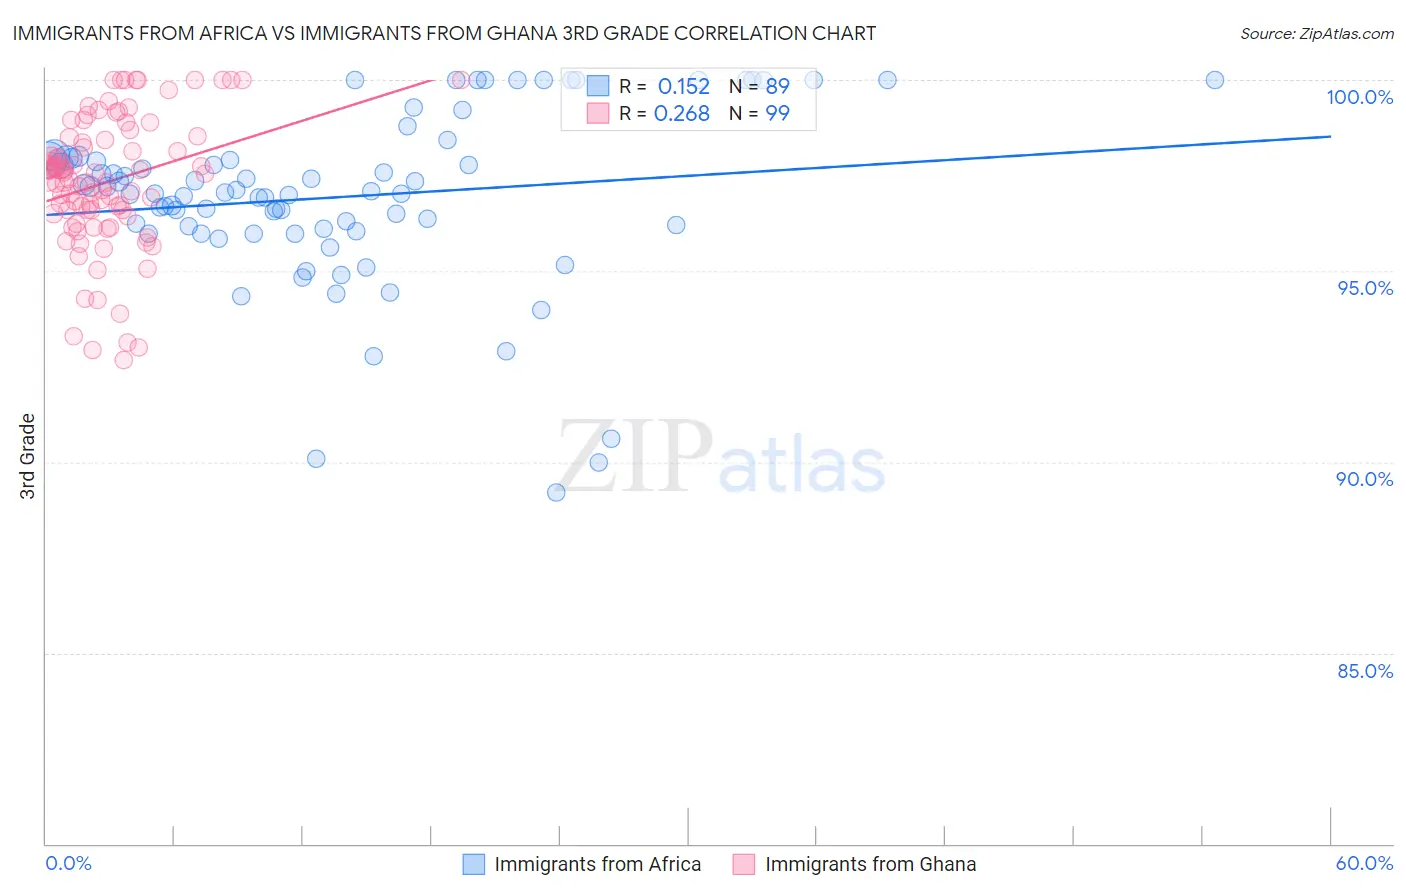
Immigrants from Africa vs Immigrants from Ghana 3rd Grade Correlation Chart
The statistical analysis conducted on geographies consisting of 469,440,174 people shows a poor positive correlation between the proportion of Immigrants from Africa and percentage of population with at least 3rd grade education in the United States with a correlation coefficient (R) of 0.152 and weighted average of 97.4%. Similarly, the statistical analysis conducted on geographies consisting of 199,952,023 people shows a weak positive correlation between the proportion of Immigrants from Ghana and percentage of population with at least 3rd grade education in the United States with a correlation coefficient (R) of 0.268 and weighted average of 97.2%, a difference of 0.21%.
3rd Grade Correlation Summary
| Measurement | Immigrants from Africa | Immigrants from Ghana |
| Minimum | 89.2% | 92.7% |
| Maximum | 100.0% | 100.0% |
| Range | 10.8% | 7.3% |
| Mean | 96.9% | 97.3% |
| Median | 97.1% | 97.4% |
| Interquartile 25% (IQ1) | 96.1% | 96.5% |
| Interquartile 75% (IQ3) | 98.0% | 98.5% |
| Interquartile Range (IQR) | 1.9% | 2.0% |
| Standard Deviation (Sample) | 2.3% | 1.7% |
| Standard Deviation (Population) | 2.3% | 1.7% |
Similar Demographics by 3rd Grade
Demographics Similar to Immigrants from Africa by 3rd Grade
In terms of 3rd grade, the demographic groups most similar to Immigrants from Africa are Immigrants from Asia (97.4%, a difference of 0.0%), Peruvian (97.4%, a difference of 0.0%), Immigrants from Eastern Africa (97.4%, a difference of 0.010%), South American (97.4%, a difference of 0.010%), and Immigrants from Middle Africa (97.4%, a difference of 0.010%).
| Demographics | Rating | Rank | 3rd Grade |
| Immigrants | Senegal | 1.0 /100 | #246 | Tragic 97.4% |
| Assyrians/Chaldeans/Syriacs | 1.0 /100 | #247 | Tragic 97.4% |
| Immigrants | Eastern Africa | 0.9 /100 | #248 | Tragic 97.4% |
| South Americans | 0.9 /100 | #249 | Tragic 97.4% |
| Immigrants | Middle Africa | 0.9 /100 | #250 | Tragic 97.4% |
| Immigrants | Asia | 0.8 /100 | #251 | Tragic 97.4% |
| Peruvians | 0.8 /100 | #252 | Tragic 97.4% |
| Immigrants | Africa | 0.8 /100 | #253 | Tragic 97.4% |
| Jamaicans | 0.7 /100 | #254 | Tragic 97.4% |
| Bolivians | 0.6 /100 | #255 | Tragic 97.3% |
| Immigrants | Congo | 0.6 /100 | #256 | Tragic 97.3% |
| Immigrants | Colombia | 0.5 /100 | #257 | Tragic 97.3% |
| Immigrants | Liberia | 0.5 /100 | #258 | Tragic 97.3% |
| Armenians | 0.4 /100 | #259 | Tragic 97.3% |
| Immigrants | Ethiopia | 0.4 /100 | #260 | Tragic 97.3% |
Demographics Similar to Immigrants from Ghana by 3rd Grade
In terms of 3rd grade, the demographic groups most similar to Immigrants from Ghana are Immigrants from Philippines (97.2%, a difference of 0.0%), Immigrants from Bolivia (97.2%, a difference of 0.010%), Trinidadian and Tobagonian (97.2%, a difference of 0.010%), Immigrants from Western Africa (97.2%, a difference of 0.010%), and Barbadian (97.2%, a difference of 0.010%).
| Demographics | Rating | Rank | 3rd Grade |
| Immigrants | Peru | 0.1 /100 | #273 | Tragic 97.2% |
| Immigrants | Cameroon | 0.1 /100 | #274 | Tragic 97.2% |
| Immigrants | Uzbekistan | 0.1 /100 | #275 | Tragic 97.2% |
| Immigrants | Bolivia | 0.1 /100 | #276 | Tragic 97.2% |
| Trinidadians and Tobagonians | 0.1 /100 | #277 | Tragic 97.2% |
| Immigrants | Western Africa | 0.1 /100 | #278 | Tragic 97.2% |
| Immigrants | Philippines | 0.1 /100 | #279 | Tragic 97.2% |
| Immigrants | Ghana | 0.1 /100 | #280 | Tragic 97.2% |
| Barbadians | 0.1 /100 | #281 | Tragic 97.2% |
| Afghans | 0.1 /100 | #282 | Tragic 97.1% |
| Houma | 0.1 /100 | #283 | Tragic 97.1% |
| Immigrants | Trinidad and Tobago | 0.0 /100 | #284 | Tragic 97.1% |
| Immigrants | Hong Kong | 0.0 /100 | #285 | Tragic 97.1% |
| Immigrants | Barbados | 0.0 /100 | #286 | Tragic 97.1% |
| Immigrants | St. Vincent and the Grenadines | 0.0 /100 | #287 | Tragic 97.1% |