Hungarian vs Comanche 8th Grade
COMPARE
Hungarian
Comanche
8th Grade
8th Grade Comparison
Hungarians
Comanche
97.0%
8TH GRADE
100.0/ 100
METRIC RATING
39th/ 347
METRIC RANK
95.5%
8TH GRADE
16.3/ 100
METRIC RATING
206th/ 347
METRIC RANK
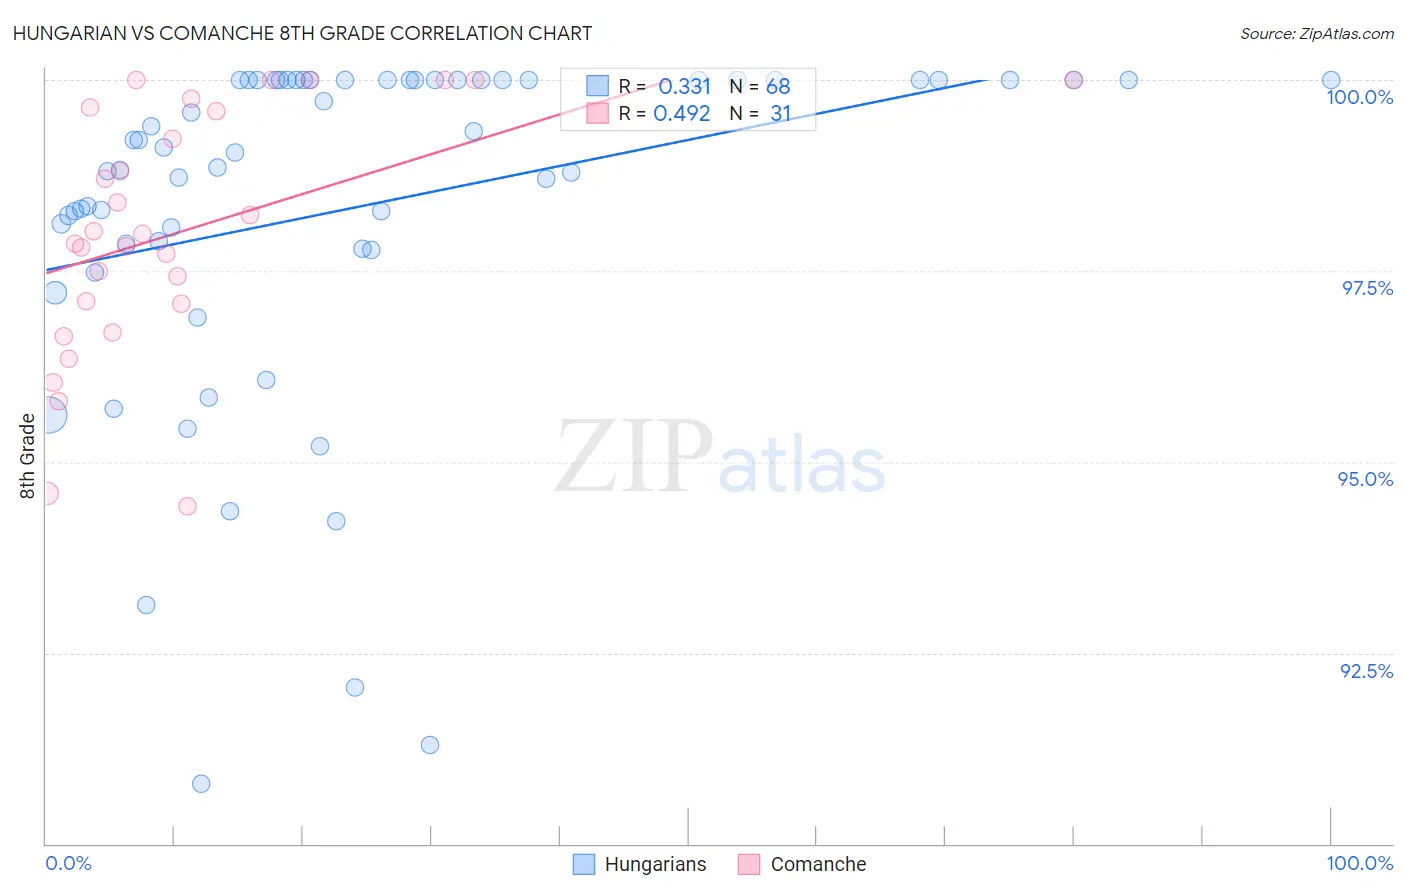
Hungarian vs Comanche 8th Grade Correlation Chart
The statistical analysis conducted on geographies consisting of 486,239,439 people shows a mild positive correlation between the proportion of Hungarians and percentage of population with at least 8th grade education in the United States with a correlation coefficient (R) of 0.331 and weighted average of 97.0%. Similarly, the statistical analysis conducted on geographies consisting of 109,786,530 people shows a moderate positive correlation between the proportion of Comanche and percentage of population with at least 8th grade education in the United States with a correlation coefficient (R) of 0.492 and weighted average of 95.5%, a difference of 1.6%.
8th Grade Correlation Summary
| Measurement | Hungarian | Comanche |
| Minimum | 90.8% | 94.4% |
| Maximum | 100.0% | 100.0% |
| Range | 9.2% | 5.6% |
| Mean | 98.3% | 98.0% |
| Median | 99.1% | 98.0% |
| Interquartile 25% (IQ1) | 97.8% | 97.1% |
| Interquartile 75% (IQ3) | 100.0% | 99.6% |
| Interquartile Range (IQR) | 2.2% | 2.6% |
| Standard Deviation (Sample) | 2.3% | 1.6% |
| Standard Deviation (Population) | 2.2% | 1.6% |
Similar Demographics by 8th Grade
Demographics Similar to Hungarians by 8th Grade
In terms of 8th grade, the demographic groups most similar to Hungarians are British (97.0%, a difference of 0.0%), Inupiat (97.0%, a difference of 0.010%), Belgian (97.0%, a difference of 0.020%), Latvian (97.0%, a difference of 0.020%), and Eastern European (97.0%, a difference of 0.020%).
| Demographics | Rating | Rank | 8th Grade |
| Yup'ik | 100.0 /100 | #32 | Exceptional 97.0% |
| Swiss | 100.0 /100 | #33 | Exceptional 97.0% |
| Luxembourgers | 100.0 /100 | #34 | Exceptional 97.0% |
| Alaska Natives | 100.0 /100 | #35 | Exceptional 97.0% |
| Belgians | 100.0 /100 | #36 | Exceptional 97.0% |
| Latvians | 100.0 /100 | #37 | Exceptional 97.0% |
| British | 100.0 /100 | #38 | Exceptional 97.0% |
| Hungarians | 100.0 /100 | #39 | Exceptional 97.0% |
| Inupiat | 100.0 /100 | #40 | Exceptional 97.0% |
| Eastern Europeans | 100.0 /100 | #41 | Exceptional 97.0% |
| Chinese | 100.0 /100 | #42 | Exceptional 96.9% |
| Aleuts | 99.9 /100 | #43 | Exceptional 96.9% |
| Maltese | 99.9 /100 | #44 | Exceptional 96.9% |
| Northern Europeans | 99.9 /100 | #45 | Exceptional 96.9% |
| Czechoslovakians | 99.9 /100 | #46 | Exceptional 96.9% |
Demographics Similar to Comanche by 8th Grade
In terms of 8th grade, the demographic groups most similar to Comanche are Immigrants from Bahamas (95.5%, a difference of 0.0%), Moroccan (95.5%, a difference of 0.010%), Hawaiian (95.5%, a difference of 0.010%), Immigrants from Sudan (95.5%, a difference of 0.020%), and Apache (95.5%, a difference of 0.030%).
| Demographics | Rating | Rank | 8th Grade |
| Immigrants | Northern Africa | 22.5 /100 | #199 | Fair 95.5% |
| Argentineans | 22.2 /100 | #200 | Fair 95.5% |
| Immigrants | Argentina | 20.6 /100 | #201 | Fair 95.5% |
| Apache | 19.4 /100 | #202 | Poor 95.5% |
| Moroccans | 17.4 /100 | #203 | Poor 95.5% |
| Hawaiians | 16.7 /100 | #204 | Poor 95.5% |
| Immigrants | Bahamas | 16.7 /100 | #205 | Poor 95.5% |
| Comanche | 16.3 /100 | #206 | Poor 95.5% |
| Immigrants | Sudan | 15.1 /100 | #207 | Poor 95.5% |
| Portuguese | 14.3 /100 | #208 | Poor 95.5% |
| Immigrants | Lebanon | 13.7 /100 | #209 | Poor 95.4% |
| Africans | 13.6 /100 | #210 | Poor 95.4% |
| Immigrants | Morocco | 12.4 /100 | #211 | Poor 95.4% |
| Immigrants | Pakistan | 9.7 /100 | #212 | Tragic 95.4% |
| Laotians | 9.0 /100 | #213 | Tragic 95.4% |