Hmong vs Immigrants from Malaysia 3rd Grade
COMPARE
Hmong
Immigrants from Malaysia
3rd Grade
3rd Grade Comparison
Hmong
Immigrants from Malaysia
97.9%
3RD GRADE
80.3/ 100
METRIC RATING
142nd/ 347
METRIC RANK
97.5%
3RD GRADE
2.4/ 100
METRIC RATING
233rd/ 347
METRIC RANK
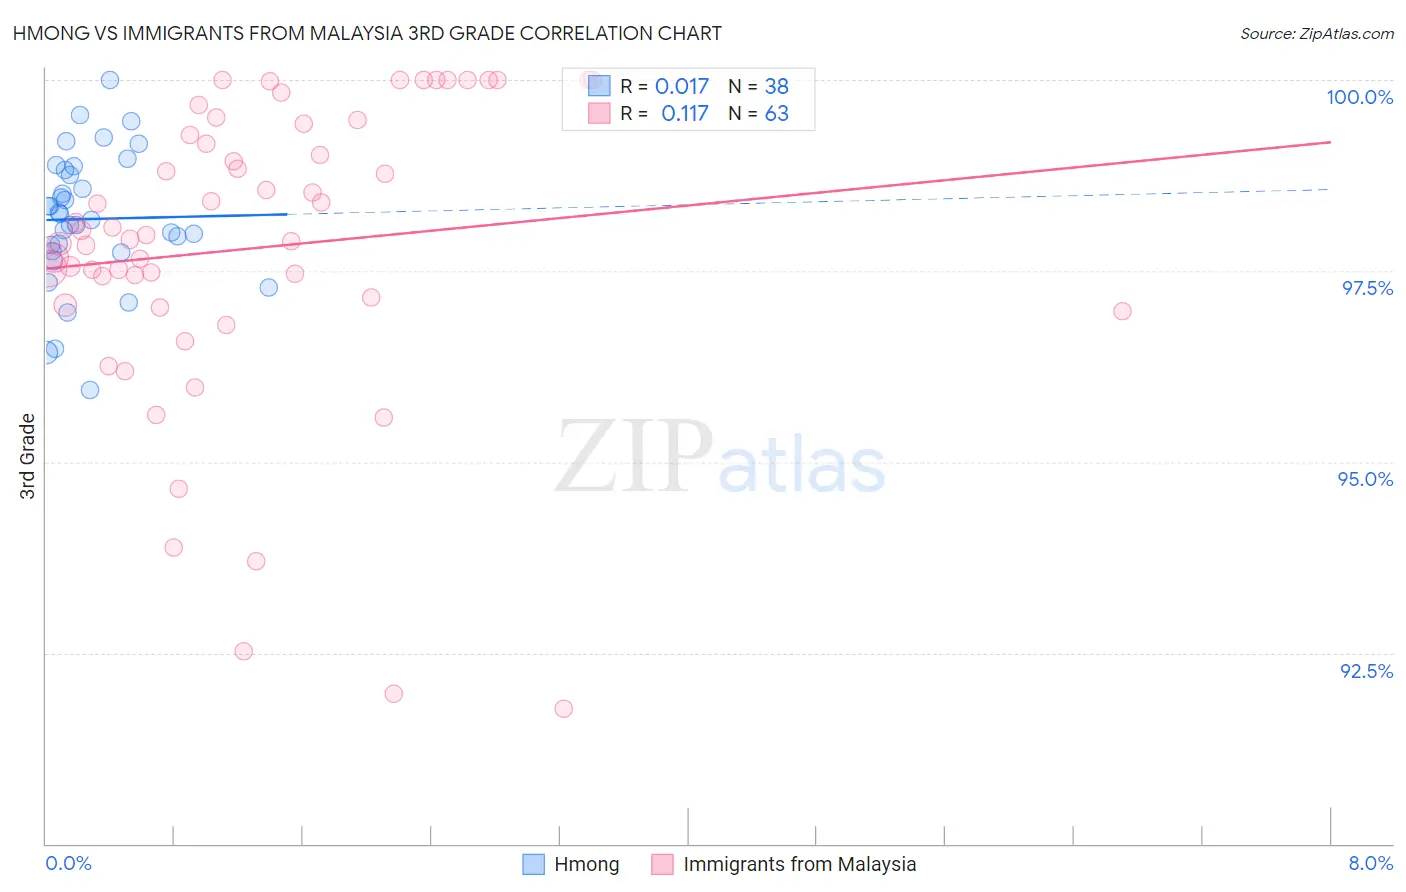
Hmong vs Immigrants from Malaysia 3rd Grade Correlation Chart
The statistical analysis conducted on geographies consisting of 24,672,093 people shows no correlation between the proportion of Hmong and percentage of population with at least 3rd grade education in the United States with a correlation coefficient (R) of 0.017 and weighted average of 97.9%. Similarly, the statistical analysis conducted on geographies consisting of 197,973,709 people shows a poor positive correlation between the proportion of Immigrants from Malaysia and percentage of population with at least 3rd grade education in the United States with a correlation coefficient (R) of 0.117 and weighted average of 97.5%, a difference of 0.43%.
3rd Grade Correlation Summary
| Measurement | Hmong | Immigrants from Malaysia |
| Minimum | 95.9% | 91.8% |
| Maximum | 100.0% | 100.0% |
| Range | 4.1% | 8.2% |
| Mean | 98.2% | 97.8% |
| Median | 98.2% | 98.0% |
| Interquartile 25% (IQ1) | 97.8% | 97.0% |
| Interquartile 75% (IQ3) | 98.8% | 99.4% |
| Interquartile Range (IQR) | 1.1% | 2.4% |
| Standard Deviation (Sample) | 0.88% | 2.0% |
| Standard Deviation (Population) | 0.87% | 2.0% |
Similar Demographics by 3rd Grade
Demographics Similar to Hmong by 3rd Grade
In terms of 3rd grade, the demographic groups most similar to Hmong are Filipino (97.9%, a difference of 0.0%), Burmese (97.9%, a difference of 0.0%), Immigrants from Greece (97.9%, a difference of 0.0%), Alsatian (97.9%, a difference of 0.010%), and Immigrants from Turkey (97.9%, a difference of 0.020%).
| Demographics | Rating | Rank | 3rd Grade |
| Cambodians | 88.1 /100 | #135 | Excellent 97.9% |
| Spaniards | 87.9 /100 | #136 | Excellent 97.9% |
| Immigrants | Romania | 87.9 /100 | #137 | Excellent 97.9% |
| Israelis | 86.6 /100 | #138 | Excellent 97.9% |
| Blackfeet | 86.3 /100 | #139 | Excellent 97.9% |
| Palestinians | 84.6 /100 | #140 | Excellent 97.9% |
| Immigrants | Turkey | 83.5 /100 | #141 | Excellent 97.9% |
| Hmong | 80.3 /100 | #142 | Excellent 97.9% |
| Filipinos | 79.9 /100 | #143 | Good 97.9% |
| Burmese | 79.6 /100 | #144 | Good 97.9% |
| Immigrants | Greece | 79.5 /100 | #145 | Good 97.9% |
| Alsatians | 78.3 /100 | #146 | Good 97.9% |
| Immigrants | Israel | 77.3 /100 | #147 | Good 97.9% |
| Immigrants | Moldova | 77.1 /100 | #148 | Good 97.9% |
| Immigrants | North Macedonia | 74.5 /100 | #149 | Good 97.8% |
Demographics Similar to Immigrants from Malaysia by 3rd Grade
In terms of 3rd grade, the demographic groups most similar to Immigrants from Malaysia are Immigrants from Western Asia (97.5%, a difference of 0.0%), Immigrants from Pakistan (97.5%, a difference of 0.010%), Immigrants from Costa Rica (97.5%, a difference of 0.010%), Subsaharan African (97.5%, a difference of 0.020%), and Senegalese (97.5%, a difference of 0.020%).
| Demographics | Rating | Rank | 3rd Grade |
| Sudanese | 4.1 /100 | #226 | Tragic 97.5% |
| Immigrants | Sudan | 3.4 /100 | #227 | Tragic 97.5% |
| Sub-Saharan Africans | 3.2 /100 | #228 | Tragic 97.5% |
| Senegalese | 3.0 /100 | #229 | Tragic 97.5% |
| Immigrants | Pakistan | 2.7 /100 | #230 | Tragic 97.5% |
| Immigrants | Costa Rica | 2.7 /100 | #231 | Tragic 97.5% |
| Immigrants | Western Asia | 2.6 /100 | #232 | Tragic 97.5% |
| Immigrants | Malaysia | 2.4 /100 | #233 | Tragic 97.5% |
| Immigrants | Eastern Asia | 1.9 /100 | #234 | Tragic 97.4% |
| Immigrants | Iraq | 1.8 /100 | #235 | Tragic 97.4% |
| Liberians | 1.8 /100 | #236 | Tragic 97.4% |
| Colombians | 1.8 /100 | #237 | Tragic 97.4% |
| Immigrants | Uruguay | 1.7 /100 | #238 | Tragic 97.4% |
| Nigerians | 1.6 /100 | #239 | Tragic 97.4% |
| U.S. Virgin Islanders | 1.4 /100 | #240 | Tragic 97.4% |