Hmong vs Chilean 1st Grade
COMPARE
Hmong
Chilean
1st Grade
1st Grade Comparison
Hmong
Chileans
98.0%
1ST GRADE
79.0/ 100
METRIC RATING
145th/ 347
METRIC RANK
97.9%
1ST GRADE
55.6/ 100
METRIC RATING
168th/ 347
METRIC RANK
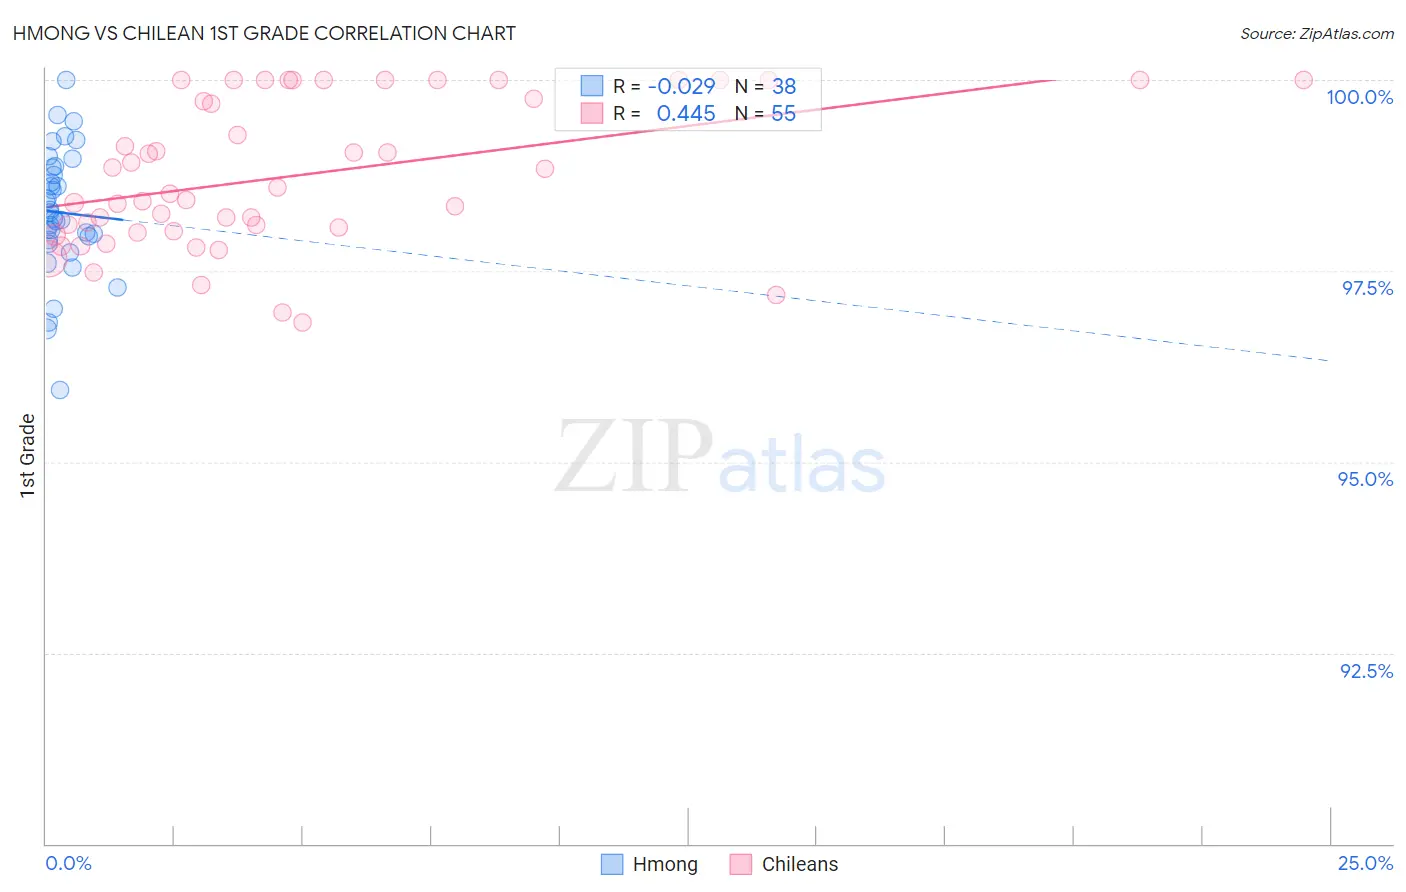
Hmong vs Chilean 1st Grade Correlation Chart
The statistical analysis conducted on geographies consisting of 24,672,093 people shows no correlation between the proportion of Hmong and percentage of population with at least 1st grade education in the United States with a correlation coefficient (R) of -0.029 and weighted average of 98.0%. Similarly, the statistical analysis conducted on geographies consisting of 256,684,337 people shows a moderate positive correlation between the proportion of Chileans and percentage of population with at least 1st grade education in the United States with a correlation coefficient (R) of 0.445 and weighted average of 97.9%, a difference of 0.090%.
1st Grade Correlation Summary
| Measurement | Hmong | Chilean |
| Minimum | 95.9% | 96.8% |
| Maximum | 100.0% | 100.0% |
| Range | 4.1% | 3.2% |
| Mean | 98.3% | 98.8% |
| Median | 98.2% | 98.5% |
| Interquartile 25% (IQ1) | 97.9% | 98.0% |
| Interquartile 75% (IQ3) | 98.9% | 100.0% |
| Interquartile Range (IQR) | 0.95% | 2.0% |
| Standard Deviation (Sample) | 0.83% | 0.96% |
| Standard Deviation (Population) | 0.82% | 0.95% |
Similar Demographics by 1st Grade
Demographics Similar to Hmong by 1st Grade
In terms of 1st grade, the demographic groups most similar to Hmong are Marshallese (98.0%, a difference of 0.010%), Burmese (98.0%, a difference of 0.010%), Alsatian (98.0%, a difference of 0.010%), Immigrants from Israel (98.0%, a difference of 0.010%), and Filipino (98.0%, a difference of 0.010%).
| Demographics | Rating | Rank | 1st Grade |
| Immigrants | Romania | 87.8 /100 | #138 | Excellent 98.1% |
| Blackfeet | 87.6 /100 | #139 | Excellent 98.1% |
| Palestinians | 83.0 /100 | #140 | Excellent 98.0% |
| Immigrants | Turkey | 82.8 /100 | #141 | Excellent 98.0% |
| Marshallese | 82.0 /100 | #142 | Excellent 98.0% |
| Burmese | 81.0 /100 | #143 | Excellent 98.0% |
| Alsatians | 80.9 /100 | #144 | Excellent 98.0% |
| Hmong | 79.0 /100 | #145 | Good 98.0% |
| Immigrants | Israel | 77.8 /100 | #146 | Good 98.0% |
| Filipinos | 77.6 /100 | #147 | Good 98.0% |
| Apache | 75.2 /100 | #148 | Good 98.0% |
| Immigrants | Greece | 74.9 /100 | #149 | Good 98.0% |
| Jordanians | 72.7 /100 | #150 | Good 98.0% |
| Dutch West Indians | 69.8 /100 | #151 | Good 98.0% |
| Immigrants | Moldova | 69.5 /100 | #152 | Good 98.0% |
Demographics Similar to Chileans by 1st Grade
In terms of 1st grade, the demographic groups most similar to Chileans are Ugandan (97.9%, a difference of 0.0%), Navajo (97.9%, a difference of 0.0%), Bermudan (97.9%, a difference of 0.0%), Immigrants from Micronesia (97.9%, a difference of 0.0%), and Immigrants from Spain (97.9%, a difference of 0.0%).
| Demographics | Rating | Rank | 1st Grade |
| Immigrants | Italy | 59.1 /100 | #161 | Average 97.9% |
| Immigrants | Eastern Europe | 58.9 /100 | #162 | Average 97.9% |
| Spanish Americans | 57.7 /100 | #163 | Average 97.9% |
| Brazilians | 57.6 /100 | #164 | Average 97.9% |
| Ugandans | 56.9 /100 | #165 | Average 97.9% |
| Navajo | 56.6 /100 | #166 | Average 97.9% |
| Bermudans | 56.3 /100 | #167 | Average 97.9% |
| Chileans | 55.6 /100 | #168 | Average 97.9% |
| Immigrants | Micronesia | 55.3 /100 | #169 | Average 97.9% |
| Immigrants | Spain | 54.9 /100 | #170 | Average 97.9% |
| Immigrants | Jordan | 53.9 /100 | #171 | Average 97.9% |
| Immigrants | Korea | 53.0 /100 | #172 | Average 97.9% |
| Kenyans | 51.2 /100 | #173 | Average 97.9% |
| Natives/Alaskans | 50.0 /100 | #174 | Average 97.9% |
| Immigrants | Sri Lanka | 49.7 /100 | #175 | Average 97.9% |