Hispanic or Latino vs Tongan 6th Grade
COMPARE
Hispanic or Latino
Tongan
6th Grade
6th Grade Comparison
Hispanics or Latinos
Tongans
95.0%
6TH GRADE
0.0/ 100
METRIC RATING
326th/ 347
METRIC RANK
96.7%
6TH GRADE
6.1/ 100
METRIC RATING
221st/ 347
METRIC RANK
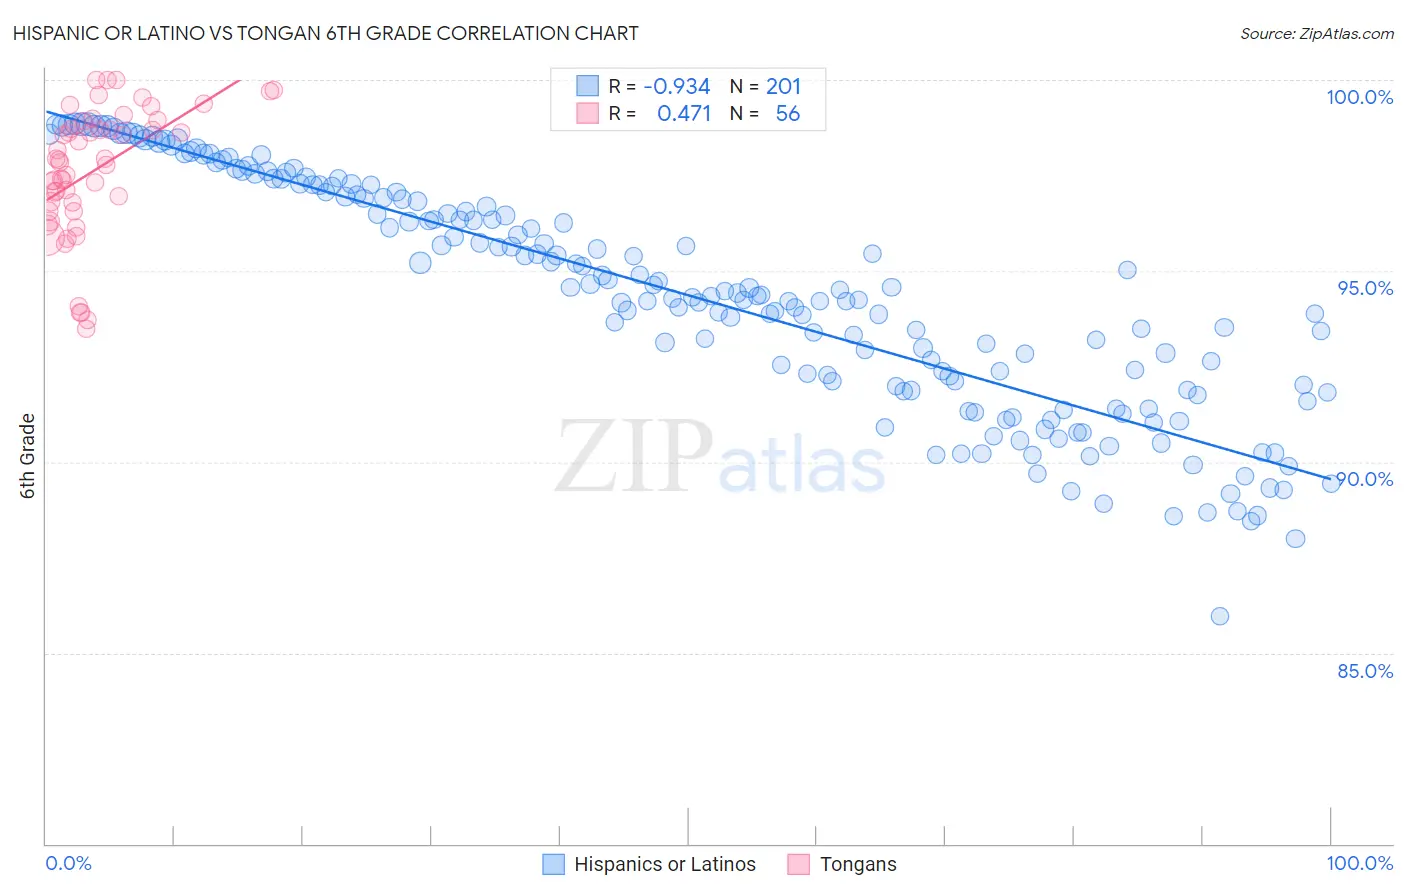
Hispanic or Latino vs Tongan 6th Grade Correlation Chart
The statistical analysis conducted on geographies consisting of 578,615,201 people shows a near-perfect negative correlation between the proportion of Hispanics or Latinos and percentage of population with at least 6th grade education in the United States with a correlation coefficient (R) of -0.934 and weighted average of 95.0%. Similarly, the statistical analysis conducted on geographies consisting of 102,873,790 people shows a moderate positive correlation between the proportion of Tongans and percentage of population with at least 6th grade education in the United States with a correlation coefficient (R) of 0.471 and weighted average of 96.7%, a difference of 1.8%.
6th Grade Correlation Summary
| Measurement | Hispanic or Latino | Tongan |
| Minimum | 85.9% | 93.5% |
| Maximum | 98.9% | 100.0% |
| Range | 12.9% | 6.5% |
| Mean | 94.3% | 97.6% |
| Median | 94.4% | 97.9% |
| Interquartile 25% (IQ1) | 91.9% | 96.7% |
| Interquartile 75% (IQ3) | 97.0% | 98.8% |
| Interquartile Range (IQR) | 5.0% | 2.1% |
| Standard Deviation (Sample) | 3.0% | 1.7% |
| Standard Deviation (Population) | 3.0% | 1.7% |
Similar Demographics by 6th Grade
Demographics Similar to Hispanics or Latinos by 6th Grade
In terms of 6th grade, the demographic groups most similar to Hispanics or Latinos are Mexican American Indian (95.0%, a difference of 0.020%), Honduran (95.0%, a difference of 0.030%), Immigrants from Nicaragua (95.1%, a difference of 0.070%), Cape Verdean (95.1%, a difference of 0.10%), and Dominican (94.9%, a difference of 0.10%).
| Demographics | Rating | Rank | 6th Grade |
| Immigrants | Belize | 0.0 /100 | #319 | Tragic 95.3% |
| Immigrants | Ecuador | 0.0 /100 | #320 | Tragic 95.3% |
| Immigrants | Fiji | 0.0 /100 | #321 | Tragic 95.2% |
| Immigrants | Cambodia | 0.0 /100 | #322 | Tragic 95.2% |
| Central American Indians | 0.0 /100 | #323 | Tragic 95.1% |
| Cape Verdeans | 0.0 /100 | #324 | Tragic 95.1% |
| Immigrants | Nicaragua | 0.0 /100 | #325 | Tragic 95.1% |
| Hispanics or Latinos | 0.0 /100 | #326 | Tragic 95.0% |
| Mexican American Indians | 0.0 /100 | #327 | Tragic 95.0% |
| Hondurans | 0.0 /100 | #328 | Tragic 95.0% |
| Dominicans | 0.0 /100 | #329 | Tragic 94.9% |
| Nepalese | 0.0 /100 | #330 | Tragic 94.9% |
| Immigrants | Armenia | 0.0 /100 | #331 | Tragic 94.9% |
| Immigrants | Honduras | 0.0 /100 | #332 | Tragic 94.8% |
| Immigrants | Latin America | 0.0 /100 | #333 | Tragic 94.7% |
Demographics Similar to Tongans by 6th Grade
In terms of 6th grade, the demographic groups most similar to Tongans are Immigrants from Morocco (96.7%, a difference of 0.0%), Immigrants from Syria (96.7%, a difference of 0.0%), Costa Rican (96.8%, a difference of 0.010%), Liberian (96.8%, a difference of 0.020%), and Navajo (96.8%, a difference of 0.020%).
| Demographics | Rating | Rank | 6th Grade |
| Portuguese | 8.2 /100 | #214 | Tragic 96.8% |
| Sierra Leoneans | 8.0 /100 | #215 | Tragic 96.8% |
| Paiute | 7.8 /100 | #216 | Tragic 96.8% |
| Liberians | 7.5 /100 | #217 | Tragic 96.8% |
| Navajo | 7.3 /100 | #218 | Tragic 96.8% |
| Costa Ricans | 6.8 /100 | #219 | Tragic 96.8% |
| Immigrants | Morocco | 6.2 /100 | #220 | Tragic 96.7% |
| Tongans | 6.1 /100 | #221 | Tragic 96.7% |
| Immigrants | Syria | 5.9 /100 | #222 | Tragic 96.7% |
| Bahamians | 4.8 /100 | #223 | Tragic 96.7% |
| Immigrants | Southern Europe | 4.4 /100 | #224 | Tragic 96.7% |
| Immigrants | Pakistan | 4.4 /100 | #225 | Tragic 96.7% |
| Immigrants | Panama | 4.2 /100 | #226 | Tragic 96.7% |
| Immigrants | Western Asia | 4.1 /100 | #227 | Tragic 96.7% |
| Immigrants | Malaysia | 4.0 /100 | #228 | Tragic 96.7% |