Hispanic or Latino vs Immigrants from Liberia 1st Grade
COMPARE
Hispanic or Latino
Immigrants from Liberia
1st Grade
1st Grade Comparison
Hispanics or Latinos
Immigrants from Liberia
96.9%
1ST GRADE
0.0/ 100
METRIC RATING
308th/ 347
METRIC RANK
97.5%
1ST GRADE
0.3/ 100
METRIC RATING
266th/ 347
METRIC RANK
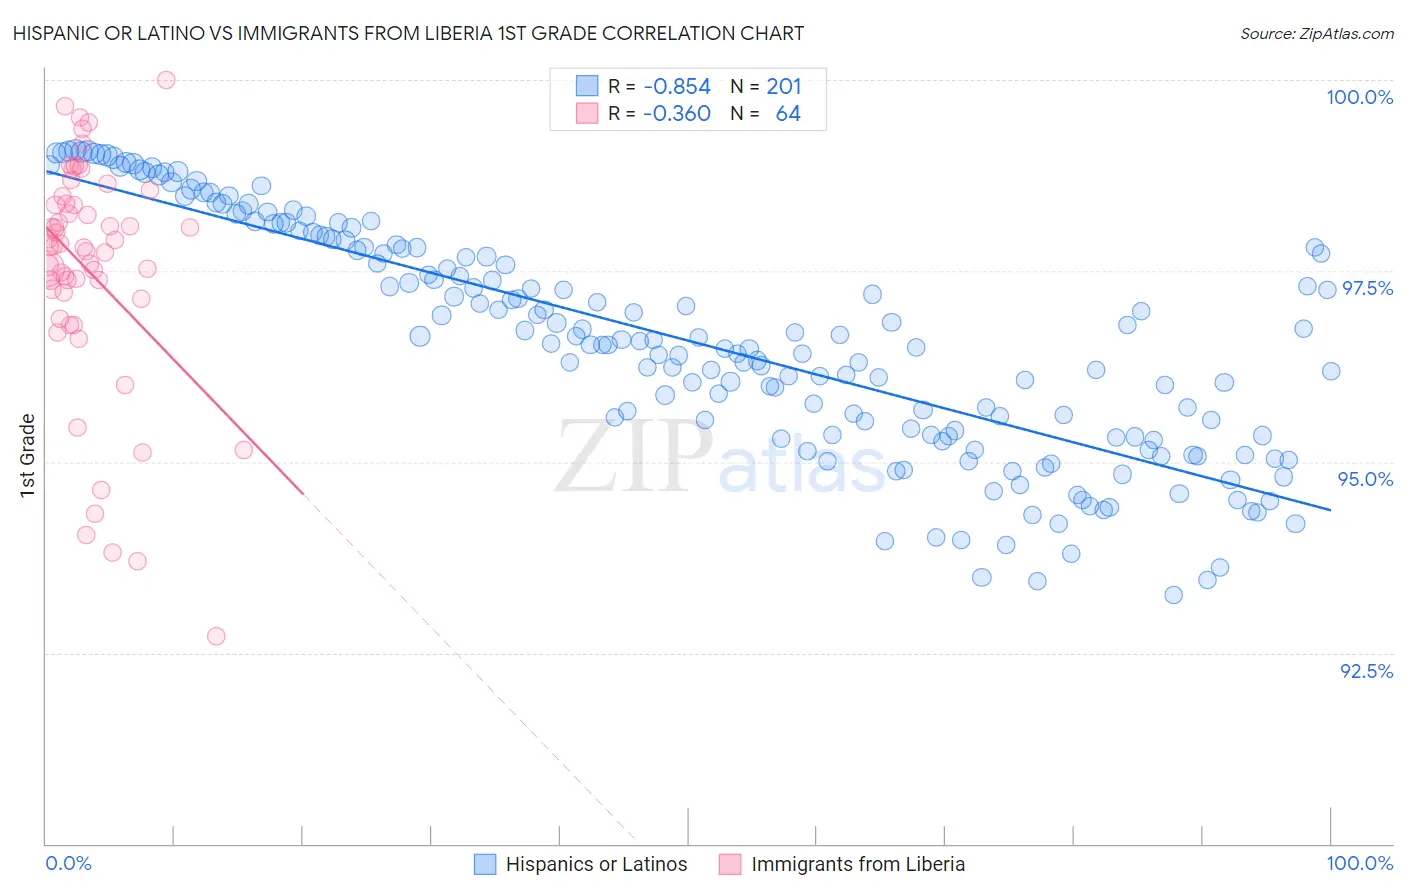
Hispanic or Latino vs Immigrants from Liberia 1st Grade Correlation Chart
The statistical analysis conducted on geographies consisting of 578,615,396 people shows a very strong negative correlation between the proportion of Hispanics or Latinos and percentage of population with at least 1st grade education in the United States with a correlation coefficient (R) of -0.854 and weighted average of 96.9%. Similarly, the statistical analysis conducted on geographies consisting of 135,294,272 people shows a mild negative correlation between the proportion of Immigrants from Liberia and percentage of population with at least 1st grade education in the United States with a correlation coefficient (R) of -0.360 and weighted average of 97.5%, a difference of 0.58%.
1st Grade Correlation Summary
| Measurement | Hispanic or Latino | Immigrants from Liberia |
| Minimum | 93.3% | 92.7% |
| Maximum | 99.1% | 100.0% |
| Range | 5.8% | 7.3% |
| Mean | 96.6% | 97.5% |
| Median | 96.5% | 97.8% |
| Interquartile 25% (IQ1) | 95.3% | 97.2% |
| Interquartile 75% (IQ3) | 97.8% | 98.4% |
| Interquartile Range (IQR) | 2.5% | 1.2% |
| Standard Deviation (Sample) | 1.5% | 1.5% |
| Standard Deviation (Population) | 1.5% | 1.5% |
Similar Demographics by 1st Grade
Demographics Similar to Hispanics or Latinos by 1st Grade
In terms of 1st grade, the demographic groups most similar to Hispanics or Latinos are Immigrants from Somalia (96.9%, a difference of 0.0%), Immigrants from Haiti (96.9%, a difference of 0.0%), Belizean (96.9%, a difference of 0.010%), Immigrants from the Azores (96.9%, a difference of 0.010%), and Sri Lankan (96.9%, a difference of 0.030%).
| Demographics | Rating | Rank | 1st Grade |
| Immigrants | South Eastern Asia | 0.0 /100 | #301 | Tragic 97.1% |
| Immigrants | Caribbean | 0.0 /100 | #302 | Tragic 97.0% |
| Somalis | 0.0 /100 | #303 | Tragic 97.0% |
| Nicaraguans | 0.0 /100 | #304 | Tragic 97.0% |
| Ecuadorians | 0.0 /100 | #305 | Tragic 97.0% |
| Belizeans | 0.0 /100 | #306 | Tragic 96.9% |
| Immigrants | Somalia | 0.0 /100 | #307 | Tragic 96.9% |
| Hispanics or Latinos | 0.0 /100 | #308 | Tragic 96.9% |
| Immigrants | Haiti | 0.0 /100 | #309 | Tragic 96.9% |
| Immigrants | Azores | 0.0 /100 | #310 | Tragic 96.9% |
| Sri Lankans | 0.0 /100 | #311 | Tragic 96.9% |
| Cape Verdeans | 0.0 /100 | #312 | Tragic 96.9% |
| Guyanese | 0.0 /100 | #313 | Tragic 96.9% |
| Hondurans | 0.0 /100 | #314 | Tragic 96.9% |
| Immigrants | Belize | 0.0 /100 | #315 | Tragic 96.9% |
Demographics Similar to Immigrants from Liberia by 1st Grade
In terms of 1st grade, the demographic groups most similar to Immigrants from Liberia are Cuban (97.5%, a difference of 0.0%), Immigrants from Sierra Leone (97.5%, a difference of 0.0%), Immigrants from South America (97.5%, a difference of 0.010%), Taiwanese (97.5%, a difference of 0.010%), and Immigrants from Nigeria (97.5%, a difference of 0.010%).
| Demographics | Rating | Rank | 1st Grade |
| Fijians | 0.5 /100 | #259 | Tragic 97.5% |
| Armenians | 0.5 /100 | #260 | Tragic 97.5% |
| Immigrants | Ethiopia | 0.4 /100 | #261 | Tragic 97.5% |
| Assyrians/Chaldeans/Syriacs | 0.4 /100 | #262 | Tragic 97.5% |
| Immigrants | South America | 0.4 /100 | #263 | Tragic 97.5% |
| Taiwanese | 0.4 /100 | #264 | Tragic 97.5% |
| Cubans | 0.3 /100 | #265 | Tragic 97.5% |
| Immigrants | Liberia | 0.3 /100 | #266 | Tragic 97.5% |
| Immigrants | Sierra Leone | 0.3 /100 | #267 | Tragic 97.5% |
| Immigrants | Nigeria | 0.3 /100 | #268 | Tragic 97.5% |
| West Indians | 0.3 /100 | #269 | Tragic 97.5% |
| Immigrants | Jamaica | 0.2 /100 | #270 | Tragic 97.5% |
| Immigrants | Cameroon | 0.2 /100 | #271 | Tragic 97.4% |
| Immigrants | Peru | 0.2 /100 | #272 | Tragic 97.4% |
| Immigrants | Bolivia | 0.2 /100 | #273 | Tragic 97.4% |