Hispanic or Latino vs Burmese 8th Grade
COMPARE
Hispanic or Latino
Burmese
8th Grade
8th Grade Comparison
Hispanics or Latinos
Burmese
92.2%
8TH GRADE
0.0/ 100
METRIC RATING
333rd/ 347
METRIC RANK
96.1%
8TH GRADE
90.2/ 100
METRIC RATING
138th/ 347
METRIC RANK
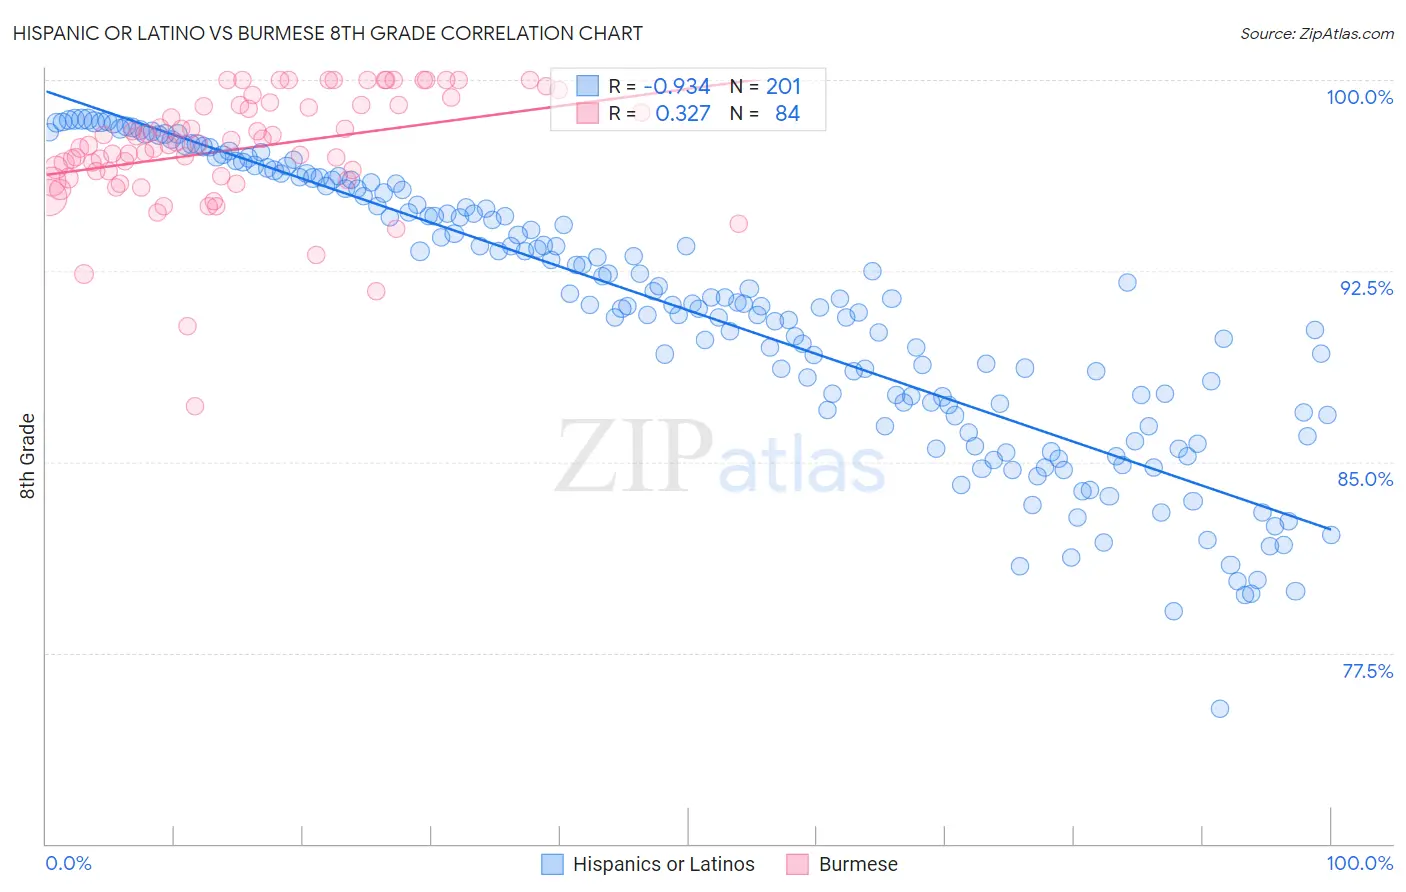
Hispanic or Latino vs Burmese 8th Grade Correlation Chart
The statistical analysis conducted on geographies consisting of 578,614,481 people shows a near-perfect negative correlation between the proportion of Hispanics or Latinos and percentage of population with at least 8th grade education in the United States with a correlation coefficient (R) of -0.934 and weighted average of 92.2%. Similarly, the statistical analysis conducted on geographies consisting of 465,275,888 people shows a mild positive correlation between the proportion of Burmese and percentage of population with at least 8th grade education in the United States with a correlation coefficient (R) of 0.327 and weighted average of 96.1%, a difference of 4.2%.
8th Grade Correlation Summary
| Measurement | Hispanic or Latino | Burmese |
| Minimum | 75.3% | 87.2% |
| Maximum | 98.5% | 100.0% |
| Range | 23.2% | 12.8% |
| Mean | 90.9% | 97.3% |
| Median | 91.2% | 97.5% |
| Interquartile 25% (IQ1) | 86.9% | 96.2% |
| Interquartile 75% (IQ3) | 95.7% | 99.0% |
| Interquartile Range (IQR) | 8.9% | 2.8% |
| Standard Deviation (Sample) | 5.4% | 2.3% |
| Standard Deviation (Population) | 5.3% | 2.3% |
Similar Demographics by 8th Grade
Demographics Similar to Hispanics or Latinos by 8th Grade
In terms of 8th grade, the demographic groups most similar to Hispanics or Latinos are Immigrants from Yemen (92.1%, a difference of 0.060%), Immigrants from Dominican Republic (92.3%, a difference of 0.11%), Mexican American Indian (92.1%, a difference of 0.11%), Honduran (92.3%, a difference of 0.13%), and Immigrants from Armenia (92.3%, a difference of 0.14%).
| Demographics | Rating | Rank | 8th Grade |
| Central American Indians | 0.0 /100 | #326 | Tragic 92.7% |
| Immigrants | Azores | 0.0 /100 | #327 | Tragic 92.5% |
| Immigrants | Nicaragua | 0.0 /100 | #328 | Tragic 92.5% |
| Immigrants | Cabo Verde | 0.0 /100 | #329 | Tragic 92.4% |
| Immigrants | Armenia | 0.0 /100 | #330 | Tragic 92.3% |
| Hondurans | 0.0 /100 | #331 | Tragic 92.3% |
| Immigrants | Dominican Republic | 0.0 /100 | #332 | Tragic 92.3% |
| Hispanics or Latinos | 0.0 /100 | #333 | Tragic 92.2% |
| Immigrants | Yemen | 0.0 /100 | #334 | Tragic 92.1% |
| Mexican American Indians | 0.0 /100 | #335 | Tragic 92.1% |
| Immigrants | Honduras | 0.0 /100 | #336 | Tragic 91.9% |
| Immigrants | Latin America | 0.0 /100 | #337 | Tragic 91.7% |
| Central Americans | 0.0 /100 | #338 | Tragic 91.6% |
| Mexicans | 0.0 /100 | #339 | Tragic 91.4% |
| Yakama | 0.0 /100 | #340 | Tragic 91.2% |
Demographics Similar to Burmese by 8th Grade
In terms of 8th grade, the demographic groups most similar to Burmese are Cambodian (96.1%, a difference of 0.010%), Hmong (96.1%, a difference of 0.010%), Immigrants from South Central Asia (96.1%, a difference of 0.010%), Basque (96.1%, a difference of 0.020%), and Jordanian (96.1%, a difference of 0.020%).
| Demographics | Rating | Rank | 8th Grade |
| Pueblo | 92.3 /100 | #131 | Exceptional 96.1% |
| Immigrants | Kuwait | 92.2 /100 | #132 | Exceptional 96.1% |
| Immigrants | Turkey | 91.7 /100 | #133 | Exceptional 96.1% |
| Immigrants | Hungary | 91.5 /100 | #134 | Exceptional 96.1% |
| Basques | 91.5 /100 | #135 | Exceptional 96.1% |
| Jordanians | 91.3 /100 | #136 | Exceptional 96.1% |
| Cambodians | 90.6 /100 | #137 | Exceptional 96.1% |
| Burmese | 90.2 /100 | #138 | Exceptional 96.1% |
| Hmong | 89.7 /100 | #139 | Excellent 96.1% |
| Immigrants | South Central Asia | 89.4 /100 | #140 | Excellent 96.1% |
| Immigrants | Greece | 85.9 /100 | #141 | Excellent 96.0% |
| Immigrants | Eastern Europe | 85.4 /100 | #142 | Excellent 96.0% |
| Spanish | 85.1 /100 | #143 | Excellent 96.0% |
| Immigrants | Belarus | 84.8 /100 | #144 | Excellent 96.0% |
| Lumbee | 84.1 /100 | #145 | Excellent 96.0% |