Hawaiian vs Swedish 3rd Grade
COMPARE
Hawaiian
Swedish
3rd Grade
3rd Grade Comparison
Hawaiians
Swedes
97.7%
3RD GRADE
25.7/ 100
METRIC RATING
197th/ 347
METRIC RANK
98.5%
3RD GRADE
100.0/ 100
METRIC RATING
15th/ 347
METRIC RANK
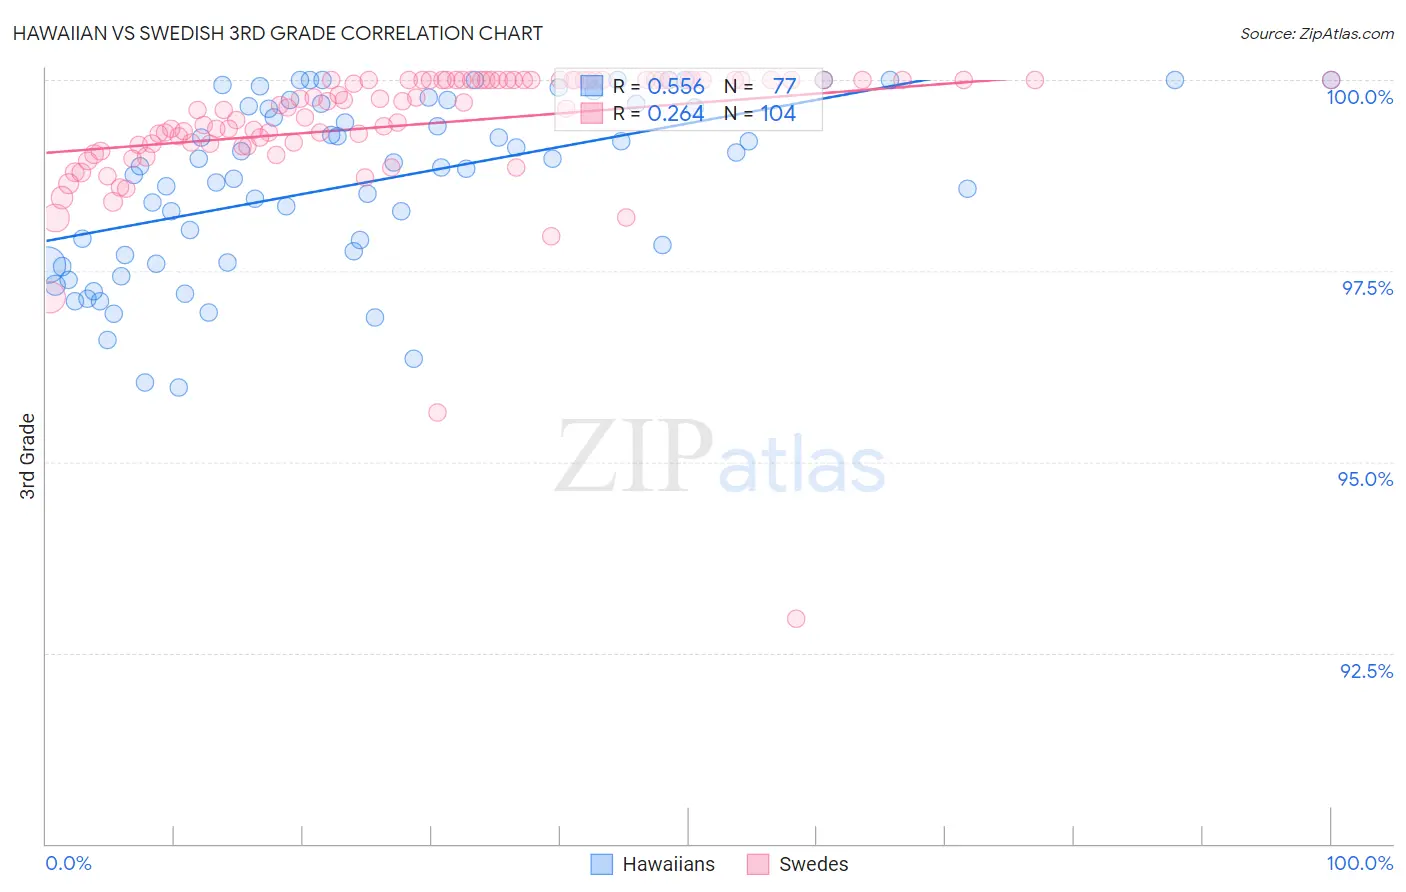
Hawaiian vs Swedish 3rd Grade Correlation Chart
The statistical analysis conducted on geographies consisting of 327,621,279 people shows a substantial positive correlation between the proportion of Hawaiians and percentage of population with at least 3rd grade education in the United States with a correlation coefficient (R) of 0.556 and weighted average of 97.7%. Similarly, the statistical analysis conducted on geographies consisting of 539,231,492 people shows a weak positive correlation between the proportion of Swedes and percentage of population with at least 3rd grade education in the United States with a correlation coefficient (R) of 0.264 and weighted average of 98.5%, a difference of 0.89%.
3rd Grade Correlation Summary
| Measurement | Hawaiian | Swedish |
| Minimum | 96.0% | 92.9% |
| Maximum | 100.0% | 100.0% |
| Range | 4.0% | 7.1% |
| Mean | 98.7% | 99.4% |
| Median | 98.9% | 99.7% |
| Interquartile 25% (IQ1) | 97.7% | 99.2% |
| Interquartile 75% (IQ3) | 99.7% | 100.0% |
| Interquartile Range (IQR) | 2.0% | 0.84% |
| Standard Deviation (Sample) | 1.1% | 0.93% |
| Standard Deviation (Population) | 1.1% | 0.93% |
Similar Demographics by 3rd Grade
Demographics Similar to Hawaiians by 3rd Grade
In terms of 3rd grade, the demographic groups most similar to Hawaiians are Immigrants from Egypt (97.7%, a difference of 0.0%), Paraguayan (97.7%, a difference of 0.0%), Mongolian (97.7%, a difference of 0.010%), Immigrants from Kenya (97.7%, a difference of 0.010%), and Immigrants from Uganda (97.7%, a difference of 0.010%).
| Demographics | Rating | Rank | 3rd Grade |
| Panamanians | 31.5 /100 | #190 | Fair 97.7% |
| Blacks/African Americans | 29.6 /100 | #191 | Fair 97.7% |
| Mongolians | 29.1 /100 | #192 | Fair 97.7% |
| Immigrants | Kenya | 28.2 /100 | #193 | Fair 97.7% |
| Immigrants | Uganda | 27.4 /100 | #194 | Fair 97.7% |
| Immigrants | Egypt | 26.8 /100 | #195 | Fair 97.7% |
| Paraguayans | 26.2 /100 | #196 | Fair 97.7% |
| Hawaiians | 25.7 /100 | #197 | Fair 97.7% |
| Guamanians/Chamorros | 23.6 /100 | #198 | Fair 97.7% |
| Immigrants | Ukraine | 22.7 /100 | #199 | Fair 97.7% |
| Immigrants | Albania | 22.6 /100 | #200 | Fair 97.7% |
| Immigrants | Lebanon | 21.7 /100 | #201 | Fair 97.7% |
| Immigrants | Southern Europe | 17.7 /100 | #202 | Poor 97.6% |
| Paiute | 16.7 /100 | #203 | Poor 97.6% |
| Immigrants | Chile | 16.5 /100 | #204 | Poor 97.6% |
Demographics Similar to Swedes by 3rd Grade
In terms of 3rd grade, the demographic groups most similar to Swedes are English (98.6%, a difference of 0.010%), Tlingit-Haida (98.5%, a difference of 0.010%), Carpatho Rusyn (98.5%, a difference of 0.010%), Scottish (98.5%, a difference of 0.020%), and Alaska Native (98.6%, a difference of 0.030%).
| Demographics | Rating | Rank | 3rd Grade |
| Slovaks | 100.0 /100 | #8 | Exceptional 98.6% |
| Germans | 100.0 /100 | #9 | Exceptional 98.6% |
| Alaska Natives | 100.0 /100 | #10 | Exceptional 98.6% |
| Slovenes | 100.0 /100 | #11 | Exceptional 98.6% |
| English | 100.0 /100 | #12 | Exceptional 98.6% |
| Tlingit-Haida | 100.0 /100 | #13 | Exceptional 98.5% |
| Carpatho Rusyns | 100.0 /100 | #14 | Exceptional 98.5% |
| Swedes | 100.0 /100 | #15 | Exceptional 98.5% |
| Scottish | 100.0 /100 | #16 | Exceptional 98.5% |
| Dutch | 100.0 /100 | #17 | Exceptional 98.5% |
| Irish | 100.0 /100 | #18 | Exceptional 98.5% |
| Poles | 100.0 /100 | #19 | Exceptional 98.5% |
| Pennsylvania Germans | 100.0 /100 | #20 | Exceptional 98.5% |
| Lithuanians | 100.0 /100 | #21 | Exceptional 98.5% |
| Finns | 100.0 /100 | #22 | Exceptional 98.5% |