Hawaiian vs Immigrants from Cameroon 12th Grade, No Diploma
COMPARE
Hawaiian
Immigrants from Cameroon
12th Grade, No Diploma
12th Grade, No Diploma Comparison
Hawaiians
Immigrants from Cameroon
90.8%
12TH GRADE, NO DIPLOMA
19.7/ 100
METRIC RATING
201st/ 347
METRIC RANK
90.5%
12TH GRADE, NO DIPLOMA
7.4/ 100
METRIC RATING
218th/ 347
METRIC RANK
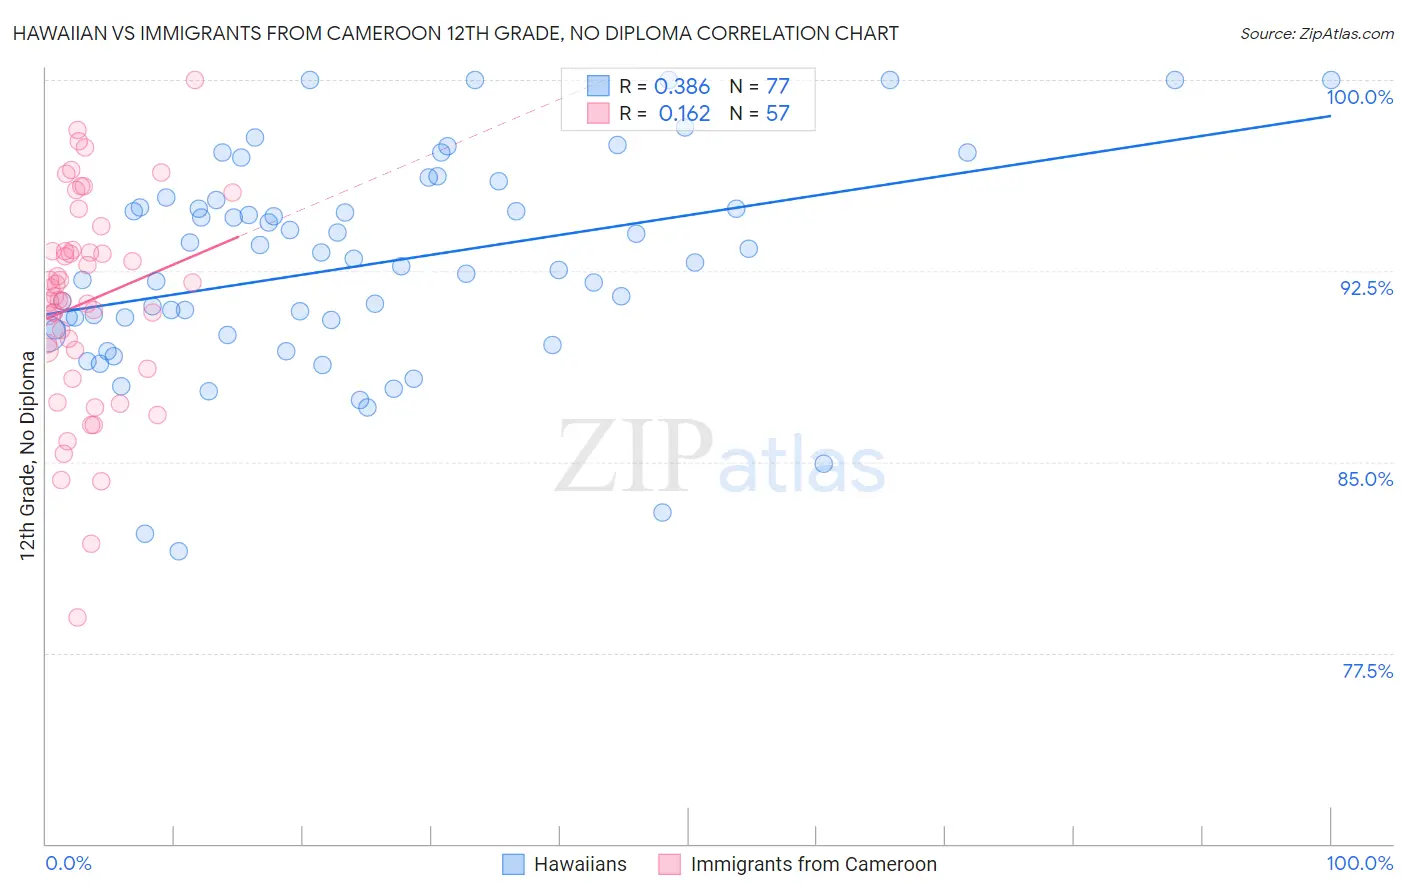
Hawaiian vs Immigrants from Cameroon 12th Grade, No Diploma Correlation Chart
The statistical analysis conducted on geographies consisting of 327,621,279 people shows a mild positive correlation between the proportion of Hawaiians and percentage of population with at least 12th grade (no diploma) education in the United States with a correlation coefficient (R) of 0.386 and weighted average of 90.8%. Similarly, the statistical analysis conducted on geographies consisting of 130,618,704 people shows a poor positive correlation between the proportion of Immigrants from Cameroon and percentage of population with at least 12th grade (no diploma) education in the United States with a correlation coefficient (R) of 0.162 and weighted average of 90.5%, a difference of 0.35%.
12th Grade, No Diploma Correlation Summary
| Measurement | Hawaiian | Immigrants from Cameroon |
| Minimum | 81.5% | 78.9% |
| Maximum | 100.0% | 100.0% |
| Range | 18.5% | 21.1% |
| Mean | 92.7% | 91.3% |
| Median | 92.8% | 91.5% |
| Interquartile 25% (IQ1) | 90.1% | 89.0% |
| Interquartile 75% (IQ3) | 95.2% | 93.3% |
| Interquartile Range (IQR) | 5.0% | 4.3% |
| Standard Deviation (Sample) | 4.1% | 4.2% |
| Standard Deviation (Population) | 4.1% | 4.1% |
Demographics Similar to Hawaiians and Immigrants from Cameroon by 12th Grade, No Diploma
In terms of 12th grade, no diploma, the demographic groups most similar to Hawaiians are Immigrants from Southern Europe (90.8%, a difference of 0.0%), Liberian (90.8%, a difference of 0.0%), Marshallese (90.7%, a difference of 0.030%), Tongan (90.7%, a difference of 0.080%), and French American Indian (90.7%, a difference of 0.090%). Similarly, the demographic groups most similar to Immigrants from Cameroon are Shoshone (90.5%, a difference of 0.0%), Cherokee (90.5%, a difference of 0.0%), Arapaho (90.5%, a difference of 0.010%), Uruguayan (90.4%, a difference of 0.020%), and Immigrants from Africa (90.5%, a difference of 0.040%).
| Demographics | Rating | Rank | 12th Grade, No Diploma |
| Immigrants | Southern Europe | 19.9 /100 | #199 | Poor 90.8% |
| Liberians | 19.8 /100 | #200 | Poor 90.8% |
| Hawaiians | 19.7 /100 | #201 | Poor 90.8% |
| Marshallese | 18.2 /100 | #202 | Poor 90.7% |
| Tongans | 16.1 /100 | #203 | Poor 90.7% |
| French American Indians | 15.5 /100 | #204 | Poor 90.7% |
| Immigrants | Sierra Leone | 14.9 /100 | #205 | Poor 90.7% |
| Immigrants | Bolivia | 12.3 /100 | #206 | Poor 90.6% |
| Armenians | 11.6 /100 | #207 | Poor 90.6% |
| Immigrants | Micronesia | 11.0 /100 | #208 | Poor 90.6% |
| Immigrants | Afghanistan | 11.0 /100 | #209 | Poor 90.6% |
| South American Indians | 10.9 /100 | #210 | Poor 90.6% |
| Portuguese | 10.6 /100 | #211 | Poor 90.6% |
| Somalis | 10.2 /100 | #212 | Poor 90.6% |
| Costa Ricans | 9.4 /100 | #213 | Tragic 90.5% |
| Immigrants | Africa | 8.5 /100 | #214 | Tragic 90.5% |
| Arapaho | 7.7 /100 | #215 | Tragic 90.5% |
| Shoshone | 7.5 /100 | #216 | Tragic 90.5% |
| Cherokee | 7.4 /100 | #217 | Tragic 90.5% |
| Immigrants | Cameroon | 7.4 /100 | #218 | Tragic 90.5% |
| Uruguayans | 7.0 /100 | #219 | Tragic 90.4% |