Haitian vs Turkish Professional Degree
COMPARE
Haitian
Turkish
Professional Degree
Professional Degree Comparison
Haitians
Turks
3.5%
PROFESSIONAL DEGREE
0.3/ 100
METRIC RATING
286th/ 347
METRIC RANK
6.2%
PROFESSIONAL DEGREE
100.0/ 100
METRIC RATING
28th/ 347
METRIC RANK
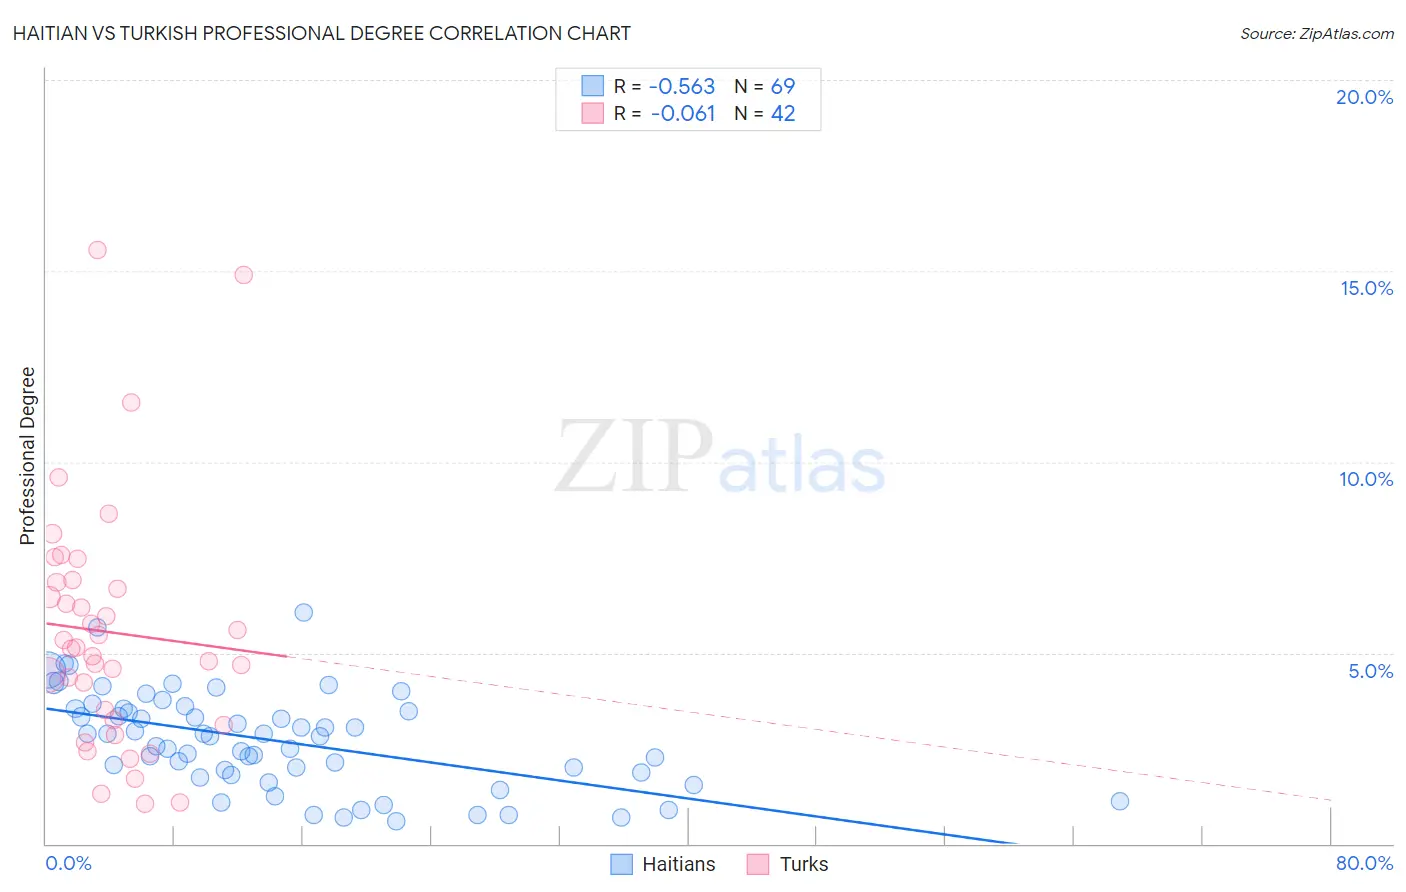
Haitian vs Turkish Professional Degree Correlation Chart
The statistical analysis conducted on geographies consisting of 287,367,803 people shows a substantial negative correlation between the proportion of Haitians and percentage of population with at least professional degree education in the United States with a correlation coefficient (R) of -0.563 and weighted average of 3.5%. Similarly, the statistical analysis conducted on geographies consisting of 271,613,931 people shows a slight negative correlation between the proportion of Turks and percentage of population with at least professional degree education in the United States with a correlation coefficient (R) of -0.061 and weighted average of 6.2%, a difference of 78.4%.
Professional Degree Correlation Summary
| Measurement | Haitian | Turkish |
| Minimum | 0.57% | 1.0% |
| Maximum | 6.1% | 15.6% |
| Range | 5.5% | 14.5% |
| Mean | 2.7% | 5.5% |
| Median | 2.8% | 5.1% |
| Interquartile 25% (IQ1) | 1.8% | 3.3% |
| Interquartile 75% (IQ3) | 3.5% | 6.9% |
| Interquartile Range (IQR) | 1.7% | 3.6% |
| Standard Deviation (Sample) | 1.3% | 3.2% |
| Standard Deviation (Population) | 1.2% | 3.2% |
Similar Demographics by Professional Degree
Demographics Similar to Haitians by Professional Degree
In terms of professional degree, the demographic groups most similar to Haitians are Immigrants from El Salvador (3.5%, a difference of 0.10%), Blackfeet (3.5%, a difference of 0.15%), Guatemalan (3.5%, a difference of 0.32%), Chippewa (3.5%, a difference of 0.33%), and Honduran (3.5%, a difference of 0.34%).
| Demographics | Rating | Rank | Professional Degree |
| Immigrants | Portugal | 0.5 /100 | #279 | Tragic 3.5% |
| Dominicans | 0.5 /100 | #280 | Tragic 3.5% |
| Apache | 0.5 /100 | #281 | Tragic 3.5% |
| Immigrants | Caribbean | 0.5 /100 | #282 | Tragic 3.5% |
| Comanche | 0.4 /100 | #283 | Tragic 3.5% |
| Salvadorans | 0.4 /100 | #284 | Tragic 3.5% |
| Hondurans | 0.3 /100 | #285 | Tragic 3.5% |
| Haitians | 0.3 /100 | #286 | Tragic 3.5% |
| Immigrants | El Salvador | 0.3 /100 | #287 | Tragic 3.5% |
| Blackfeet | 0.3 /100 | #288 | Tragic 3.5% |
| Guatemalans | 0.3 /100 | #289 | Tragic 3.5% |
| Chippewa | 0.3 /100 | #290 | Tragic 3.5% |
| Alaska Natives | 0.3 /100 | #291 | Tragic 3.5% |
| Immigrants | Belize | 0.3 /100 | #292 | Tragic 3.5% |
| Immigrants | Honduras | 0.3 /100 | #293 | Tragic 3.5% |
Demographics Similar to Turks by Professional Degree
In terms of professional degree, the demographic groups most similar to Turks are Immigrants from Northern Europe (6.2%, a difference of 0.11%), Latvian (6.2%, a difference of 0.62%), Immigrants from Sri Lanka (6.2%, a difference of 0.63%), Immigrants from Turkey (6.2%, a difference of 0.63%), and Immigrants from India (6.2%, a difference of 0.75%).
| Demographics | Rating | Rank | Professional Degree |
| Immigrants | Hong Kong | 100.0 /100 | #21 | Exceptional 6.4% |
| Immigrants | Japan | 100.0 /100 | #22 | Exceptional 6.4% |
| Russians | 100.0 /100 | #23 | Exceptional 6.3% |
| Immigrants | Spain | 100.0 /100 | #24 | Exceptional 6.3% |
| Immigrants | Ireland | 100.0 /100 | #25 | Exceptional 6.3% |
| Latvians | 100.0 /100 | #26 | Exceptional 6.2% |
| Immigrants | Northern Europe | 100.0 /100 | #27 | Exceptional 6.2% |
| Turks | 100.0 /100 | #28 | Exceptional 6.2% |
| Immigrants | Sri Lanka | 100.0 /100 | #29 | Exceptional 6.2% |
| Immigrants | Turkey | 100.0 /100 | #30 | Exceptional 6.2% |
| Immigrants | India | 100.0 /100 | #31 | Exceptional 6.2% |
| Thais | 100.0 /100 | #32 | Exceptional 6.1% |
| Burmese | 100.0 /100 | #33 | Exceptional 6.1% |
| Mongolians | 100.0 /100 | #34 | Exceptional 6.1% |
| Immigrants | Korea | 100.0 /100 | #35 | Exceptional 6.1% |