Guyanese vs Immigrants from Croatia 11th Grade
COMPARE
Guyanese
Immigrants from Croatia
11th Grade
11th Grade Comparison
Guyanese
Immigrants from Croatia
89.9%
11TH GRADE
0.0/ 100
METRIC RATING
301st/ 347
METRIC RANK
93.5%
11TH GRADE
98.6/ 100
METRIC RATING
106th/ 347
METRIC RANK
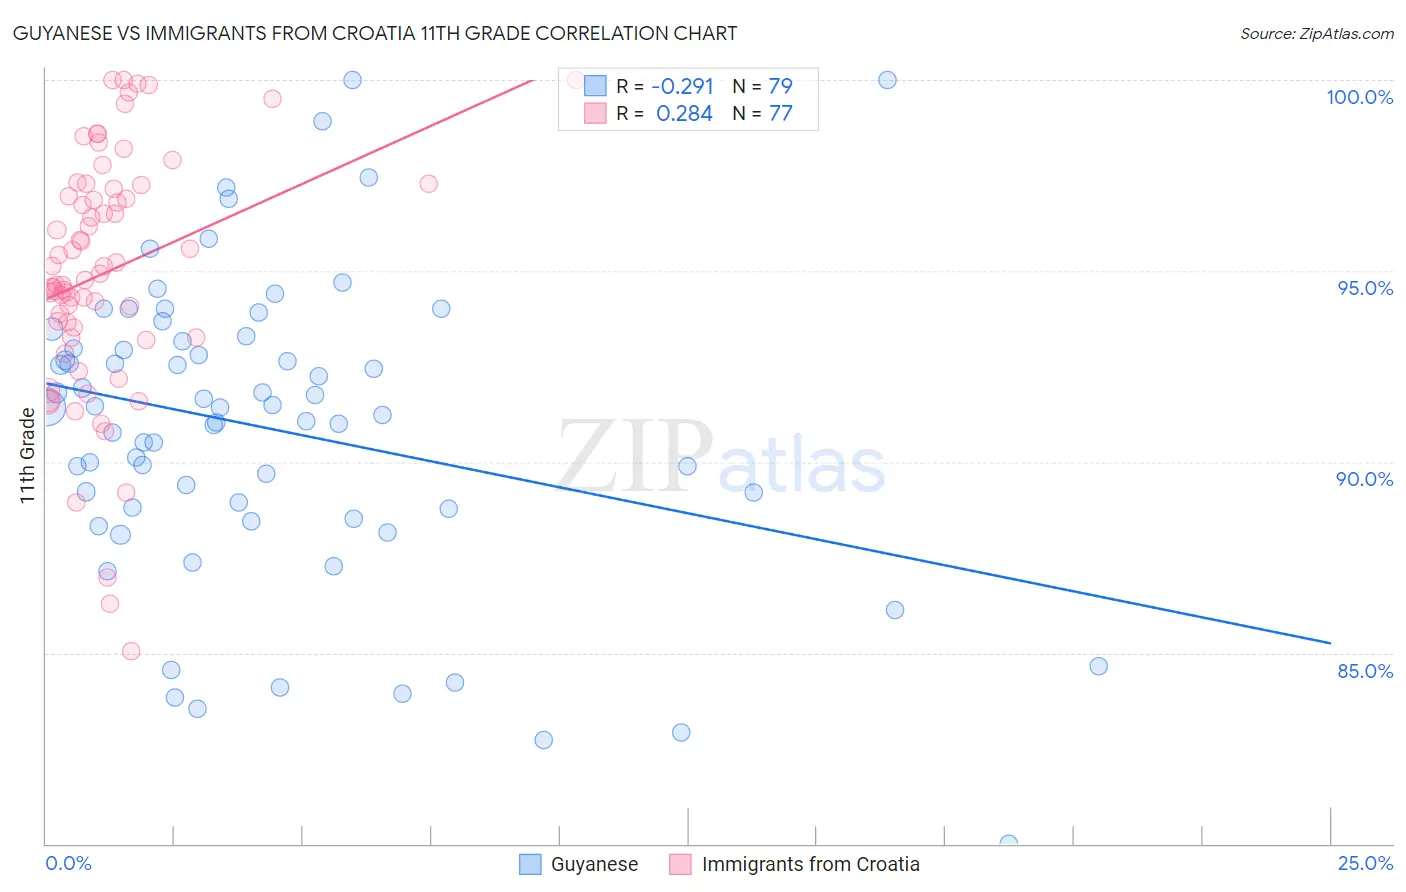
Guyanese vs Immigrants from Croatia 11th Grade Correlation Chart
The statistical analysis conducted on geographies consisting of 176,937,226 people shows a weak negative correlation between the proportion of Guyanese and percentage of population with at least 11th grade education in the United States with a correlation coefficient (R) of -0.291 and weighted average of 89.9%. Similarly, the statistical analysis conducted on geographies consisting of 132,548,291 people shows a weak positive correlation between the proportion of Immigrants from Croatia and percentage of population with at least 11th grade education in the United States with a correlation coefficient (R) of 0.284 and weighted average of 93.5%, a difference of 4.0%.
11th Grade Correlation Summary
| Measurement | Guyanese | Immigrants from Croatia |
| Minimum | 80.0% | 85.1% |
| Maximum | 100.0% | 100.0% |
| Range | 20.0% | 14.9% |
| Mean | 90.9% | 95.0% |
| Median | 91.4% | 94.9% |
| Interquartile 25% (IQ1) | 88.8% | 93.4% |
| Interquartile 75% (IQ3) | 93.2% | 97.2% |
| Interquartile Range (IQR) | 4.4% | 3.8% |
| Standard Deviation (Sample) | 4.0% | 3.2% |
| Standard Deviation (Population) | 4.0% | 3.2% |
Similar Demographics by 11th Grade
Demographics Similar to Guyanese by 11th Grade
In terms of 11th grade, the demographic groups most similar to Guyanese are Immigrants from Haiti (89.9%, a difference of 0.010%), Japanese (89.9%, a difference of 0.020%), Immigrants from Fiji (89.9%, a difference of 0.050%), Navajo (90.0%, a difference of 0.12%), and Fijian (90.0%, a difference of 0.16%).
| Demographics | Rating | Rank | 11th Grade |
| Immigrants | Grenada | 0.0 /100 | #294 | Tragic 90.1% |
| Immigrants | Vietnam | 0.0 /100 | #295 | Tragic 90.0% |
| Fijians | 0.0 /100 | #296 | Tragic 90.0% |
| Navajo | 0.0 /100 | #297 | Tragic 90.0% |
| Immigrants | Fiji | 0.0 /100 | #298 | Tragic 89.9% |
| Japanese | 0.0 /100 | #299 | Tragic 89.9% |
| Immigrants | Haiti | 0.0 /100 | #300 | Tragic 89.9% |
| Guyanese | 0.0 /100 | #301 | Tragic 89.9% |
| Immigrants | Guyana | 0.0 /100 | #302 | Tragic 89.7% |
| Immigrants | Immigrants | 0.0 /100 | #303 | Tragic 89.7% |
| Yuman | 0.0 /100 | #304 | Tragic 89.7% |
| Immigrants | Cambodia | 0.0 /100 | #305 | Tragic 89.6% |
| Ecuadorians | 0.0 /100 | #306 | Tragic 89.6% |
| Immigrants | Dominica | 0.0 /100 | #307 | Tragic 89.5% |
| Nepalese | 0.0 /100 | #308 | Tragic 89.5% |
Demographics Similar to Immigrants from Croatia by 11th Grade
In terms of 11th grade, the demographic groups most similar to Immigrants from Croatia are Lebanese (93.5%, a difference of 0.0%), Immigrants from Europe (93.5%, a difference of 0.0%), Immigrants from Serbia (93.5%, a difference of 0.0%), Immigrants from Romania (93.5%, a difference of 0.010%), and Chippewa (93.5%, a difference of 0.010%).
| Demographics | Rating | Rank | 11th Grade |
| Menominee | 98.7 /100 | #99 | Exceptional 93.5% |
| Immigrants | North Macedonia | 98.7 /100 | #100 | Exceptional 93.5% |
| Immigrants | Romania | 98.7 /100 | #101 | Exceptional 93.5% |
| Chippewa | 98.6 /100 | #102 | Exceptional 93.5% |
| Lebanese | 98.6 /100 | #103 | Exceptional 93.5% |
| Immigrants | Europe | 98.6 /100 | #104 | Exceptional 93.5% |
| Immigrants | Serbia | 98.6 /100 | #105 | Exceptional 93.5% |
| Immigrants | Croatia | 98.6 /100 | #106 | Exceptional 93.5% |
| Immigrants | Norway | 98.4 /100 | #107 | Exceptional 93.5% |
| Alaska Natives | 98.4 /100 | #108 | Exceptional 93.5% |
| Immigrants | Kuwait | 98.4 /100 | #109 | Exceptional 93.5% |
| Syrians | 98.4 /100 | #110 | Exceptional 93.4% |
| Yugoslavians | 98.1 /100 | #111 | Exceptional 93.4% |
| Immigrants | Germany | 98.0 /100 | #112 | Exceptional 93.4% |
| Immigrants | Zimbabwe | 97.8 /100 | #113 | Exceptional 93.4% |