Guatemalan vs Immigrants from Africa 8th Grade
COMPARE
Guatemalan
Immigrants from Africa
8th Grade
8th Grade Comparison
Guatemalans
Immigrants from Africa
91.1%
8TH GRADE
0.0/ 100
METRIC RATING
341st/ 347
METRIC RANK
95.2%
8TH GRADE
2.7/ 100
METRIC RATING
237th/ 347
METRIC RANK
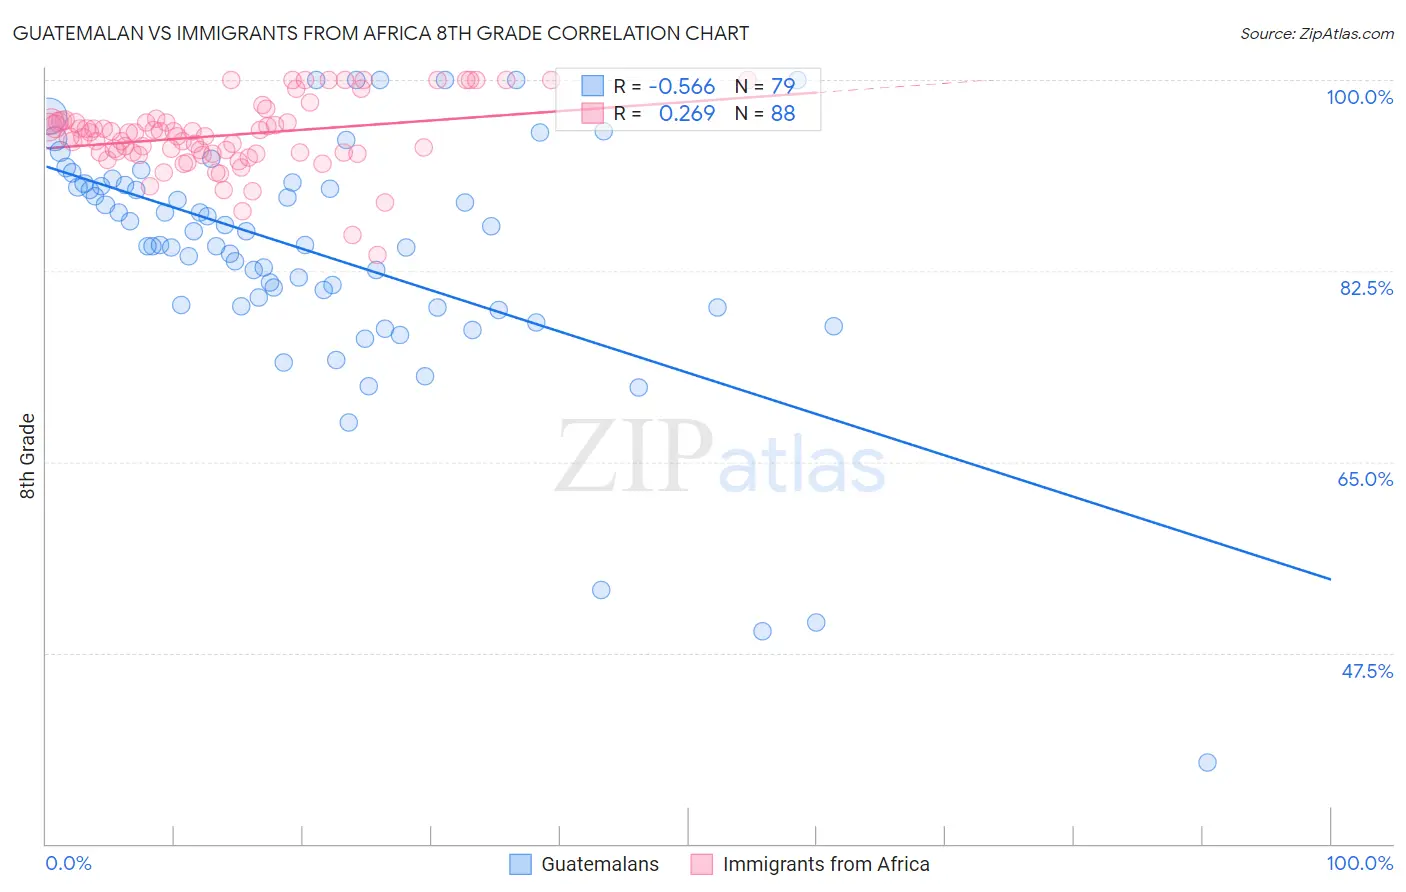
Guatemalan vs Immigrants from Africa 8th Grade Correlation Chart
The statistical analysis conducted on geographies consisting of 409,566,618 people shows a substantial negative correlation between the proportion of Guatemalans and percentage of population with at least 8th grade education in the United States with a correlation coefficient (R) of -0.566 and weighted average of 91.1%. Similarly, the statistical analysis conducted on geographies consisting of 469,408,495 people shows a weak positive correlation between the proportion of Immigrants from Africa and percentage of population with at least 8th grade education in the United States with a correlation coefficient (R) of 0.269 and weighted average of 95.2%, a difference of 4.4%.
8th Grade Correlation Summary
| Measurement | Guatemalan | Immigrants from Africa |
| Minimum | 37.5% | 84.0% |
| Maximum | 100.0% | 100.0% |
| Range | 62.5% | 16.0% |
| Mean | 84.1% | 94.9% |
| Median | 84.9% | 95.0% |
| Interquartile 25% (IQ1) | 79.3% | 93.3% |
| Interquartile 75% (IQ3) | 90.4% | 96.2% |
| Interquartile Range (IQR) | 11.1% | 2.9% |
| Standard Deviation (Sample) | 11.2% | 3.2% |
| Standard Deviation (Population) | 11.2% | 3.2% |
Similar Demographics by 8th Grade
Demographics Similar to Guatemalans by 8th Grade
In terms of 8th grade, the demographic groups most similar to Guatemalans are Yakama (91.2%, a difference of 0.11%), Mexican (91.4%, a difference of 0.24%), Salvadoran (90.9%, a difference of 0.29%), Immigrants from Guatemala (90.7%, a difference of 0.46%), and Central American (91.6%, a difference of 0.47%).
| Demographics | Rating | Rank | 8th Grade |
| Hispanics or Latinos | 0.0 /100 | #333 | Tragic 92.2% |
| Immigrants | Yemen | 0.0 /100 | #334 | Tragic 92.1% |
| Mexican American Indians | 0.0 /100 | #335 | Tragic 92.1% |
| Immigrants | Honduras | 0.0 /100 | #336 | Tragic 91.9% |
| Immigrants | Latin America | 0.0 /100 | #337 | Tragic 91.7% |
| Central Americans | 0.0 /100 | #338 | Tragic 91.6% |
| Mexicans | 0.0 /100 | #339 | Tragic 91.4% |
| Yakama | 0.0 /100 | #340 | Tragic 91.2% |
| Guatemalans | 0.0 /100 | #341 | Tragic 91.1% |
| Salvadorans | 0.0 /100 | #342 | Tragic 90.9% |
| Immigrants | Guatemala | 0.0 /100 | #343 | Tragic 90.7% |
| Immigrants | Central America | 0.0 /100 | #344 | Tragic 90.4% |
| Immigrants | El Salvador | 0.0 /100 | #345 | Tragic 90.3% |
| Immigrants | Mexico | 0.0 /100 | #346 | Tragic 90.2% |
| Spanish American Indians | 0.0 /100 | #347 | Tragic 89.8% |
Demographics Similar to Immigrants from Africa by 8th Grade
In terms of 8th grade, the demographic groups most similar to Immigrants from Africa are Senegalese (95.2%, a difference of 0.0%), Immigrants from Asia (95.2%, a difference of 0.020%), Costa Rican (95.2%, a difference of 0.020%), Nigerian (95.2%, a difference of 0.020%), and Native/Alaskan (95.2%, a difference of 0.030%).
| Demographics | Rating | Rank | 8th Grade |
| Immigrants | Panama | 4.1 /100 | #230 | Tragic 95.2% |
| Asians | 3.5 /100 | #231 | Tragic 95.2% |
| Indians (Asian) | 3.3 /100 | #232 | Tragic 95.2% |
| Immigrants | Asia | 3.1 /100 | #233 | Tragic 95.2% |
| Costa Ricans | 3.0 /100 | #234 | Tragic 95.2% |
| Nigerians | 2.9 /100 | #235 | Tragic 95.2% |
| Senegalese | 2.7 /100 | #236 | Tragic 95.2% |
| Immigrants | Africa | 2.7 /100 | #237 | Tragic 95.2% |
| Natives/Alaskans | 2.3 /100 | #238 | Tragic 95.2% |
| Immigrants | Sierra Leone | 2.1 /100 | #239 | Tragic 95.1% |
| Ethiopians | 2.0 /100 | #240 | Tragic 95.1% |
| South American Indians | 1.9 /100 | #241 | Tragic 95.1% |
| Tongans | 1.7 /100 | #242 | Tragic 95.1% |
| Paiute | 1.7 /100 | #243 | Tragic 95.1% |
| Immigrants | Middle Africa | 1.7 /100 | #244 | Tragic 95.1% |