Ghanaian vs Crow Kindergarten
COMPARE
Ghanaian
Crow
Kindergarten
Kindergarten Comparison
Ghanaians
Crow
97.4%
KINDERGARTEN
0.1/ 100
METRIC RATING
275th/ 347
METRIC RANK
99.7%
KINDERGARTEN
100.0/ 100
METRIC RATING
1st/ 347
METRIC RANK
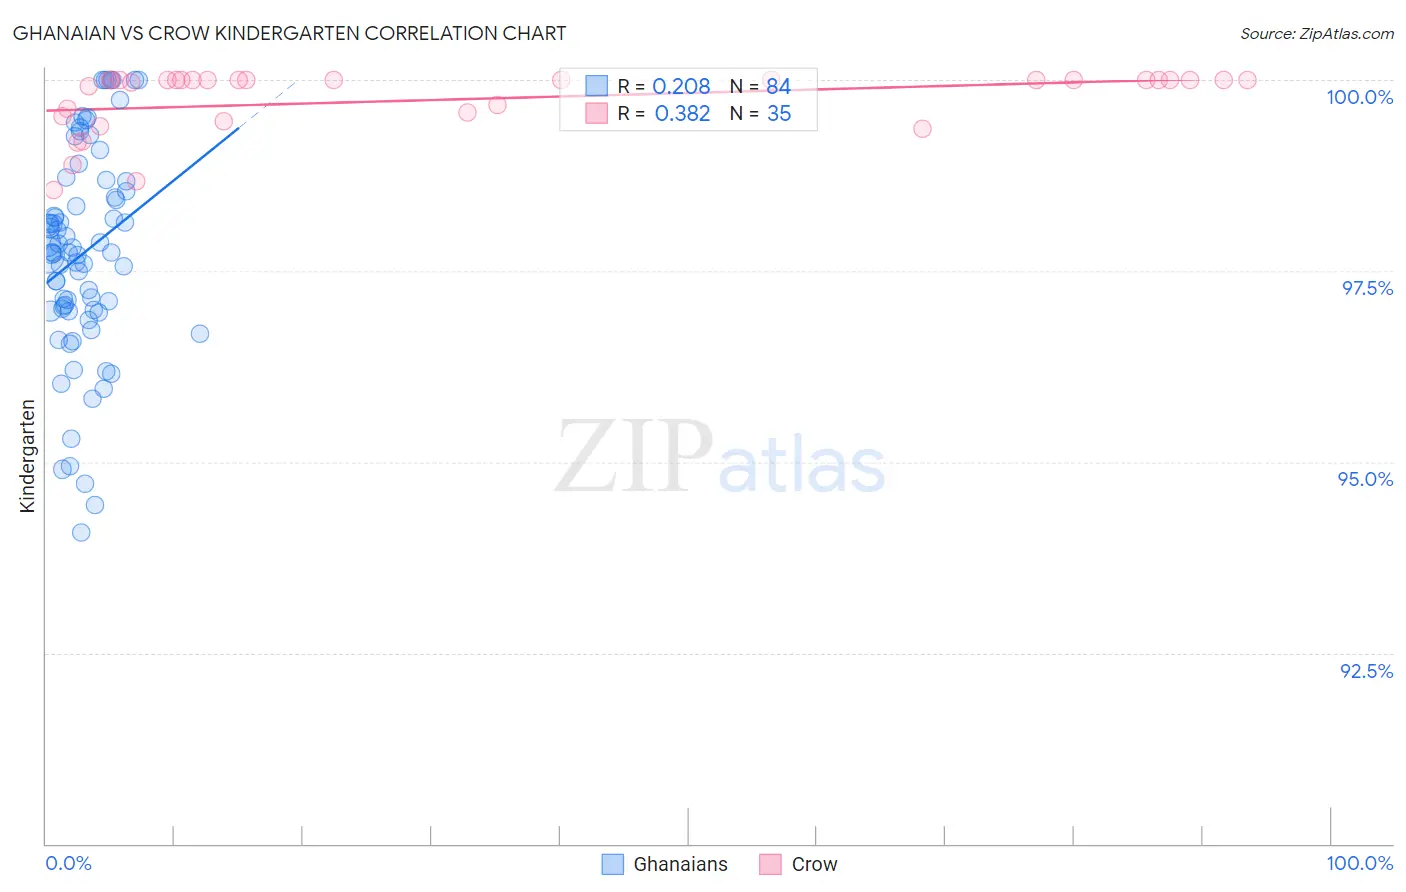
Ghanaian vs Crow Kindergarten Correlation Chart
The statistical analysis conducted on geographies consisting of 190,712,873 people shows a weak positive correlation between the proportion of Ghanaians and percentage of population with at least kindergarten education in the United States with a correlation coefficient (R) of 0.208 and weighted average of 97.4%. Similarly, the statistical analysis conducted on geographies consisting of 665,246 people shows a mild positive correlation between the proportion of Crow and percentage of population with at least kindergarten education in the United States with a correlation coefficient (R) of 0.382 and weighted average of 99.7%, a difference of 2.3%.
Kindergarten Correlation Summary
| Measurement | Ghanaian | Crow |
| Minimum | 94.1% | 98.6% |
| Maximum | 100.0% | 100.0% |
| Range | 5.9% | 1.4% |
| Mean | 97.7% | 99.7% |
| Median | 97.7% | 100.0% |
| Interquartile 25% (IQ1) | 97.0% | 99.5% |
| Interquartile 75% (IQ3) | 98.6% | 100.0% |
| Interquartile Range (IQR) | 1.6% | 0.48% |
| Standard Deviation (Sample) | 1.4% | 0.41% |
| Standard Deviation (Population) | 1.4% | 0.41% |
Similar Demographics by Kindergarten
Demographics Similar to Ghanaians by Kindergarten
In terms of kindergarten, the demographic groups most similar to Ghanaians are Immigrants from China (97.4%, a difference of 0.0%), Immigrants from Cameroon (97.4%, a difference of 0.0%), Immigrants from Philippines (97.4%, a difference of 0.020%), Immigrants from Peru (97.5%, a difference of 0.030%), and Immigrants from Bolivia (97.5%, a difference of 0.030%).
| Demographics | Rating | Rank | Kindergarten |
| Immigrants | Nigeria | 0.3 /100 | #268 | Tragic 97.5% |
| West Indians | 0.3 /100 | #269 | Tragic 97.5% |
| Immigrants | Jamaica | 0.2 /100 | #270 | Tragic 97.5% |
| Immigrants | Peru | 0.2 /100 | #271 | Tragic 97.5% |
| Immigrants | Bolivia | 0.2 /100 | #272 | Tragic 97.5% |
| Immigrants | China | 0.1 /100 | #273 | Tragic 97.4% |
| Immigrants | Cameroon | 0.1 /100 | #274 | Tragic 97.4% |
| Ghanaians | 0.1 /100 | #275 | Tragic 97.4% |
| Immigrants | Philippines | 0.1 /100 | #276 | Tragic 97.4% |
| Immigrants | Western Africa | 0.1 /100 | #277 | Tragic 97.4% |
| Immigrants | Uzbekistan | 0.1 /100 | #278 | Tragic 97.4% |
| Immigrants | Ghana | 0.1 /100 | #279 | Tragic 97.4% |
| Barbadians | 0.1 /100 | #280 | Tragic 97.4% |
| Trinidadians and Tobagonians | 0.1 /100 | #281 | Tragic 97.4% |
| Afghans | 0.0 /100 | #282 | Tragic 97.4% |
Demographics Similar to Crow by Kindergarten
In terms of kindergarten, the demographic groups most similar to Crow are Yup'ik (99.2%, a difference of 0.45%), Inupiat (98.9%, a difference of 0.78%), Welsh (98.9%, a difference of 0.79%), Tsimshian (98.8%, a difference of 0.81%), and Alaskan Athabascan (98.8%, a difference of 0.88%).
| Demographics | Rating | Rank | Kindergarten |
| Crow | 100.0 /100 | #1 | Exceptional 99.7% |
| Yup'ik | 100.0 /100 | #2 | Exceptional 99.2% |
| Inupiat | 100.0 /100 | #3 | Exceptional 98.9% |
| Welsh | 100.0 /100 | #4 | Exceptional 98.9% |
| Tsimshian | 100.0 /100 | #5 | Exceptional 98.8% |
| Alaskan Athabascans | 100.0 /100 | #6 | Exceptional 98.8% |
| Alaska Natives | 100.0 /100 | #7 | Exceptional 98.7% |
| Norwegians | 100.0 /100 | #8 | Exceptional 98.7% |
| Tlingit-Haida | 100.0 /100 | #9 | Exceptional 98.7% |
| Slovaks | 100.0 /100 | #10 | Exceptional 98.7% |
| Germans | 100.0 /100 | #11 | Exceptional 98.7% |
| Slovenes | 100.0 /100 | #12 | Exceptional 98.7% |
| Carpatho Rusyns | 100.0 /100 | #13 | Exceptional 98.7% |
| English | 100.0 /100 | #14 | Exceptional 98.7% |
| Swedes | 100.0 /100 | #15 | Exceptional 98.7% |