German vs Immigrants from Scotland 11th Grade

COMPARE

German
Race
Ancestry
AfghanAfricanAlaska NativeAlaskan AthabascanAlbanianAleutAlsatianAmericanApacheArabArapahoArgentineanArmenianAssyrian/Chaldean/SyriacAustralianAustrianBahamianBangladeshiBarbadianBasqueBelgianBelizeanBermudanBhutaneseBlackfeetBolivianBrazilianBritishBritish West IndianBulgarianBurmeseCajunCambodianCanadianCape VerdeanCarpatho RusynCelticCentral AmericanCentral American IndianCherokeeCheyenneChickasawChileanChineseChippewaChoctawColombianColvilleComancheCosta RicanCreeCreekCroatianCrowCubanCypriotCzechCzechoslovakianDanishDelawareDominicanDutchDutch West IndianEastern EuropeanEcuadorianEgyptianEnglishEstonianEthiopianEuropeanFijianFilipinoFinnishFrenchFrench American IndianFrench CanadianGermanGerman RussianGhanaianGreekGuamanian/ChamorroGuatemalanGuyaneseHaitianHmongHonduranHopiHoumaHungarianIcelanderIndian (Asian)IndonesianInupiatIranianIraqiIrishIroquoisIsraeliItalianJamaicanJapaneseJordanianKenyanKiowaKoreanLaotianLatvianLebaneseLiberianLithuanianLumbeeLuxembourgerMacedonianMalaysianMalteseMarshalleseMenomineeMexicanMexican American IndianMongolianMoroccanNative HawaiianNavajoNepaleseNew ZealanderNicaraguanNigerianNorthern EuropeanNorwegianOkinawanOsageOttawaPaiutePakistaniPalestinianPanamanianParaguayanPennsylvania GermanPeruvianPimaPolishPortuguesePotawatomiPuebloPuerto RicanPuget Sound SalishRomanianRussianSalvadoranSamoanScandinavianScotch-IrishScottishSeminoleSenegaleseSerbianShoshoneSierra LeoneanSiouxSlavicSlovakSloveneSomaliSouth AfricanSouth AmericanSouth American IndianSoviet UnionSpaniardSpanishSpanish AmericanSpanish American IndianSri LankanSubsaharan AfricanSudaneseSwedishSwissSyrianTaiwaneseThaiTlingit-HaidaTohono O'OdhamTonganTrinidadian and TobagonianTsimshianTurkishU.S. Virgin IslanderUgandanUkrainianUruguayanUteVenezuelanVietnameseWelshWest IndianYakamaYaquiYugoslavianYumanYup'ikZimbabwean
Immigration
NonimmigrantsImmigrantsAfghanistanAfricaAlbaniaArgentinaArmeniaAsiaAustraliaAustriaBahamasBangladeshBarbadosBelarusBelgiumBelizeBoliviaBosnia and HerzegovinaBrazilBulgariaBurma/MyanmarCabo VerdeCambodiaCameroonCanadaCaribbeanCentral AmericaChileChinaColombiaCongoCosta RicaCroatiaCubaCzechoslovakiaDenmarkDominicaDominican RepublicEastern AfricaEastern AsiaEastern EuropeEcuadorEgyptEl SalvadorEnglandEritreaEthiopiaEuropeFijiFranceGermanyGhanaGreeceGrenadaGuatemalaGuyanaHaitiHondurasHong KongHungaryIndiaIndonesiaIranIraqIrelandIsraelItalyJamaicaJapanJordanKazakhstanKenyaKoreaKuwaitLaosLatin AmericaLatviaLebanonLiberiaLithuaniaMalaysiaMexicoMicronesiaMiddle AfricaMoldovaMoroccoNepalNetherlandsNicaraguaNigeriaNorth AmericaNorth MacedoniaNorthern AfricaNorthern EuropeNorwayOceaniaPakistanPanamaPeruPhilippinesPolandPortugalRomaniaRussiaSaudi ArabiaSenegalSerbiaSierra LeoneSingaporeSomaliaSouth AfricaSouth AmericaSouth Central AsiaSouth Eastern AsiaSouthern EuropeSpainSri LankaSt. Vincent and the GrenadinesSudanSwedenSwitzerlandSyriaTaiwanThailandTrinidad and TobagoTurkeyUgandaUkraineUruguayUzbekistanVenezuelaVietnamWest IndiesWestern AfricaWestern AsiaWestern EuropeYemenZaireZimbabweAzores
Immigrants from Scotland
Race
Ancestry
AfghanAfricanAlaska NativeAlaskan AthabascanAlbanianAleutAlsatianAmericanApacheArabArapahoArgentineanArmenianAssyrian/Chaldean/SyriacAustralianAustrianBahamianBangladeshiBarbadianBasqueBelgianBelizeanBermudanBhutaneseBlackfeetBolivianBrazilianBritishBritish West IndianBulgarianBurmeseCajunCambodianCanadianCape VerdeanCarpatho RusynCelticCentral AmericanCentral American IndianCherokeeCheyenneChickasawChileanChineseChippewaChoctawColombianColvilleComancheCosta RicanCreeCreekCroatianCrowCubanCypriotCzechCzechoslovakianDanishDelawareDominicanDutchDutch West IndianEastern EuropeanEcuadorianEgyptianEnglishEstonianEthiopianEuropeanFijianFilipinoFinnishFrenchFrench American IndianFrench CanadianGerman RussianGhanaianGreekGuamanian/ChamorroGuatemalanGuyaneseHaitianHmongHonduranHopiHoumaHungarianIcelanderIndian (Asian)IndonesianInupiatIranianIraqiIrishIroquoisIsraeliItalianJamaicanJapaneseJordanianKenyanKiowaKoreanLaotianLatvianLebaneseLiberianLithuanianLumbeeLuxembourgerMacedonianMalaysianMalteseMarshalleseMenomineeMexicanMexican American IndianMongolianMoroccanNative HawaiianNavajoNepaleseNew ZealanderNicaraguanNigerianNorthern EuropeanNorwegianOkinawanOsageOttawaPaiutePakistaniPalestinianPanamanianParaguayanPennsylvania GermanPeruvianPimaPolishPortuguesePotawatomiPuebloPuerto RicanPuget Sound SalishRomanianRussianSalvadoranSamoanScandinavianScotch-IrishScottishSeminoleSenegaleseSerbianShoshoneSierra LeoneanSiouxSlavicSlovakSloveneSomaliSouth AfricanSouth AmericanSouth American IndianSoviet UnionSpaniardSpanishSpanish AmericanSpanish American IndianSri LankanSubsaharan AfricanSudaneseSwedishSwissSyrianTaiwaneseThaiTlingit-HaidaTohono O'OdhamTonganTrinidadian and TobagonianTsimshianTurkishU.S. Virgin IslanderUgandanUkrainianUruguayanUteVenezuelanVietnameseWelshWest IndianYakamaYaquiYugoslavianYumanYup'ikZimbabwean
Immigration
NonimmigrantsImmigrantsAfghanistanAfricaAlbaniaArgentinaArmeniaAsiaAustraliaAustriaBahamasBangladeshBarbadosBelarusBelgiumBelizeBoliviaBosnia and HerzegovinaBrazilBulgariaBurma/MyanmarCabo VerdeCambodiaCameroonCanadaCaribbeanCentral AmericaChileChinaColombiaCongoCosta RicaCroatiaCubaCzechoslovakiaDenmarkDominicaDominican RepublicEastern AfricaEastern AsiaEastern EuropeEcuadorEgyptEl SalvadorEnglandEritreaEthiopiaEuropeFijiFranceGermanyGhanaGreeceGrenadaGuatemalaGuyanaHaitiHondurasHong KongHungaryIndiaIndonesiaIranIraqIrelandIsraelItalyJamaicaJapanJordanKazakhstanKenyaKoreaKuwaitLaosLatin AmericaLatviaLebanonLiberiaLithuaniaMalaysiaMexicoMicronesiaMiddle AfricaMoldovaMoroccoNepalNetherlandsNicaraguaNigeriaNorth AmericaNorth MacedoniaNorthern AfricaNorthern EuropeNorwayOceaniaPakistanPanamaPeruPhilippinesPolandPortugalRomaniaRussiaSaudi ArabiaScotlandSenegalSerbiaSierra LeoneSingaporeSomaliaSouth AfricaSouth AmericaSouth Central AsiaSouth Eastern AsiaSouthern EuropeSpainSri LankaSt. Vincent and the GrenadinesSudanSwedenSwitzerlandSyriaTaiwanThailandTrinidad and TobagoTurkeyUgandaUkraineUruguayUzbekistanVenezuelaVietnamWest IndiesWestern AfricaWestern AsiaWestern EuropeYemenZaireZimbabweAzores
11th Grade
Income
Poverty
Unemployment
Labor Participation
Family Structure
Vehicle Availability
Education Level
Disability

11th Grade Comparison

Germans

Immigrants from Scotland

Exceptional
Exceptional
94.7%
11TH GRADE
100.0/ 100
METRIC RATING
11th/ 347
METRIC RANK
94.2%
11TH GRADE
99.9/ 100
METRIC RATING
34th/ 347
METRIC RANK

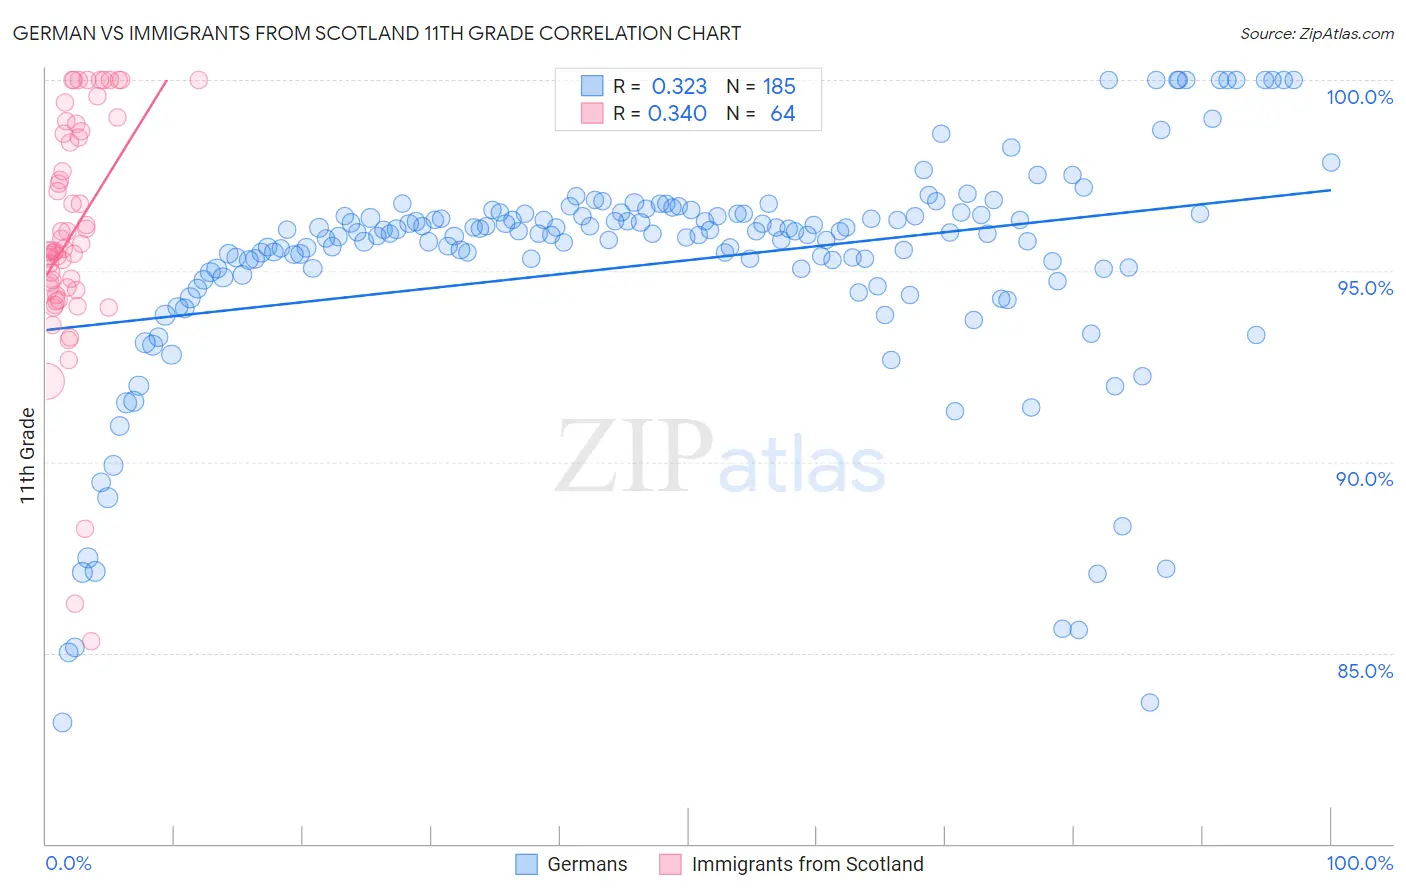
German vs Immigrants from Scotland 11th Grade Correlation Chart

The statistical analysis conducted on geographies consisting of 558,071,623 people shows a mild positive correlation between the proportion of Germans and percentage of population with at least 11th grade education in the United States with a correlation coefficient (R) of 0.323 and weighted average of 94.7%. Similarly, the statistical analysis conducted on geographies consisting of 196,398,887 people shows a mild positive correlation between the proportion of Immigrants from Scotland and percentage of population with at least 11th grade education in the United States with a correlation coefficient (R) of 0.340 and weighted average of 94.2%, a difference of 0.48%.
German vs Immigrants from Scotland 11th Grade

11th Grade Correlation Summary

MeasurementGermanImmigrants from Scotland
Minimum83.2%85.3%
Maximum100.0%100.0%
Range16.8%14.7%
Mean95.2%96.0%
Median96.0%95.6%
Interquartile 25% (IQ1)94.9%94.5%
Interquartile 75% (IQ3)96.5%98.6%
Interquartile Range (IQR)1.5%4.1%
Standard Deviation (Sample)3.1%3.1%
Standard Deviation (Population)3.1%3.1%

Similar Demographics by 11th Grade

Demographics Similar to Germans by 11th Grade

In terms of 11th grade, the demographic groups most similar to Germans are Finnish (94.7%, a difference of 0.0%), Latvian (94.7%, a difference of 0.0%), Chinese (94.6%, a difference of 0.030%), Danish (94.7%, a difference of 0.050%), and Croatian (94.7%, a difference of 0.090%).
DemographicsRating | Rank11th Grade
Slovaks
100.0
/100
|
#4
Exceptional
94.9%
Carpatho Rusyns
100.0
/100
|
#5
Exceptional
94.8%
Lithuanians
100.0
/100
|
#6
Exceptional
94.8%
Poles
100.0
/100
|
#7
Exceptional
94.8%
Croatians
100.0
/100
|
#8
Exceptional
94.7%
Danes
100.0
/100
|
#9
Exceptional
94.7%
Finns
100.0
/100
|
#10
Exceptional
94.7%
Germans
100.0
/100
|
#11
Exceptional
94.7%
Latvians
100.0
/100
|
#12
Exceptional
94.7%
Chinese
100.0
/100
|
#13
Exceptional
94.6%
Eastern Europeans
100.0
/100
|
#14
Exceptional
94.6%
Bulgarians
100.0
/100
|
#15
Exceptional
94.5%
Immigrants | India
100.0
/100
|
#16
Exceptional
94.5%
Luxembourgers
100.0
/100
|
#17
Exceptional
94.5%
Maltese
100.0
/100
|
#18
Exceptional
94.5%

Demographics Similar to Immigrants from Scotland by 11th Grade

In terms of 11th grade, the demographic groups most similar to Immigrants from Scotland are British (94.2%, a difference of 0.0%), Immigrants from Singapore (94.2%, a difference of 0.010%), Immigrants from Northern Europe (94.2%, a difference of 0.010%), Northern European (94.2%, a difference of 0.020%), and Hungarian (94.2%, a difference of 0.020%).
DemographicsRating | Rank11th Grade
Europeans
100.0
/100
|
#27
Exceptional
94.4%
Estonians
100.0
/100
|
#28
Exceptional
94.4%
Dutch
100.0
/100
|
#29
Exceptional
94.3%
Russians
100.0
/100
|
#30
Exceptional
94.3%
Welsh
99.9
/100
|
#31
Exceptional
94.2%
Belgians
99.9
/100
|
#32
Exceptional
94.2%
British
99.9
/100
|
#33
Exceptional
94.2%
Immigrants | Scotland
99.9
/100
|
#34
Exceptional
94.2%
Immigrants | Singapore
99.9
/100
|
#35
Exceptional
94.2%
Immigrants | Northern Europe
99.9
/100
|
#36
Exceptional
94.2%
Northern Europeans
99.9
/100
|
#37
Exceptional
94.2%
Hungarians
99.9
/100
|
#38
Exceptional
94.2%
Immigrants | Lithuania
99.9
/100
|
#39
Exceptional
94.1%
Thais
99.9
/100
|
#40
Exceptional
94.1%
Cypriots
99.9
/100
|
#41
Exceptional
94.1%