French American Indian vs Menominee 3rd Grade
COMPARE
French American Indian
Menominee
3rd Grade
3rd Grade Comparison
French American Indians
Menominee
97.8%
3RD GRADE
60.0/ 100
METRIC RATING
159th/ 347
METRIC RANK
98.0%
3RD GRADE
95.4/ 100
METRIC RATING
114th/ 347
METRIC RANK
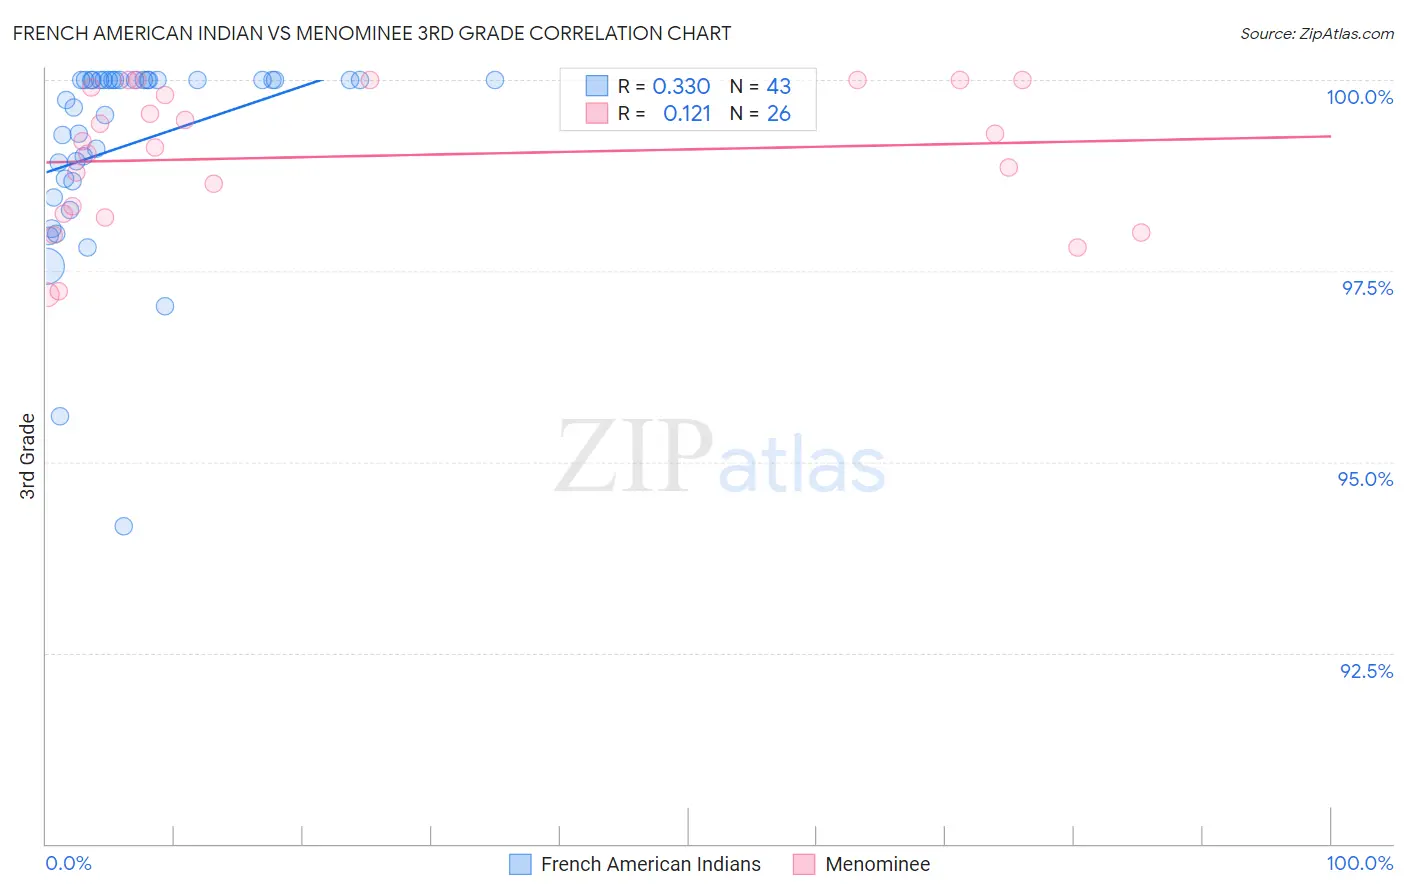
French American Indian vs Menominee 3rd Grade Correlation Chart
The statistical analysis conducted on geographies consisting of 131,974,854 people shows a mild positive correlation between the proportion of French American Indians and percentage of population with at least 3rd grade education in the United States with a correlation coefficient (R) of 0.330 and weighted average of 97.8%. Similarly, the statistical analysis conducted on geographies consisting of 45,778,979 people shows a poor positive correlation between the proportion of Menominee and percentage of population with at least 3rd grade education in the United States with a correlation coefficient (R) of 0.121 and weighted average of 98.0%, a difference of 0.22%.
3rd Grade Correlation Summary
| Measurement | French American Indian | Menominee |
| Minimum | 94.2% | 97.2% |
| Maximum | 100.0% | 100.0% |
| Range | 5.8% | 2.8% |
| Mean | 99.2% | 99.0% |
| Median | 100.0% | 99.2% |
| Interquartile 25% (IQ1) | 98.7% | 98.3% |
| Interquartile 75% (IQ3) | 100.0% | 99.9% |
| Interquartile Range (IQR) | 1.3% | 1.6% |
| Standard Deviation (Sample) | 1.3% | 0.89% |
| Standard Deviation (Population) | 1.3% | 0.88% |
Similar Demographics by 3rd Grade
Demographics Similar to French American Indians by 3rd Grade
In terms of 3rd grade, the demographic groups most similar to French American Indians are Immigrants from Italy (97.8%, a difference of 0.0%), Venezuelan (97.8%, a difference of 0.0%), Immigrants from Iran (97.8%, a difference of 0.0%), Albanian (97.8%, a difference of 0.0%), and Immigrants from Eastern Europe (97.8%, a difference of 0.010%).
| Demographics | Rating | Rank | 3rd Grade |
| Immigrants | South Central Asia | 69.5 /100 | #152 | Good 97.8% |
| Apache | 68.5 /100 | #153 | Good 97.8% |
| Immigrants | Eastern Europe | 64.1 /100 | #154 | Good 97.8% |
| Bermudans | 62.6 /100 | #155 | Good 97.8% |
| Immigrants | Russia | 61.7 /100 | #156 | Good 97.8% |
| Immigrants | Italy | 61.2 /100 | #157 | Good 97.8% |
| Venezuelans | 60.9 /100 | #158 | Good 97.8% |
| French American Indians | 60.0 /100 | #159 | Average 97.8% |
| Immigrants | Iran | 59.1 /100 | #160 | Average 97.8% |
| Albanians | 58.8 /100 | #161 | Average 97.8% |
| Immigrants | Jordan | 57.9 /100 | #162 | Average 97.8% |
| Marshallese | 57.2 /100 | #163 | Average 97.8% |
| Immigrants | Bosnia and Herzegovina | 56.2 /100 | #164 | Average 97.8% |
| Ugandans | 56.1 /100 | #165 | Average 97.8% |
| Dutch West Indians | 55.5 /100 | #166 | Average 97.8% |
Demographics Similar to Menominee by 3rd Grade
In terms of 3rd grade, the demographic groups most similar to Menominee are Thai (98.0%, a difference of 0.0%), Okinawan (98.0%, a difference of 0.0%), Immigrants from Norway (98.0%, a difference of 0.0%), Immigrants from Latvia (98.0%, a difference of 0.010%), and Immigrants from France (98.0%, a difference of 0.010%).
| Demographics | Rating | Rank | 3rd Grade |
| Immigrants | Czechoslovakia | 97.0 /100 | #107 | Exceptional 98.0% |
| Immigrants | Singapore | 96.7 /100 | #108 | Exceptional 98.0% |
| Pima | 96.7 /100 | #109 | Exceptional 98.0% |
| Immigrants | Switzerland | 96.6 /100 | #110 | Exceptional 98.0% |
| Basques | 96.5 /100 | #111 | Exceptional 98.0% |
| Immigrants | Latvia | 96.0 /100 | #112 | Exceptional 98.0% |
| Thais | 95.5 /100 | #113 | Exceptional 98.0% |
| Menominee | 95.4 /100 | #114 | Exceptional 98.0% |
| Okinawans | 95.2 /100 | #115 | Exceptional 98.0% |
| Immigrants | Norway | 95.2 /100 | #116 | Exceptional 98.0% |
| Immigrants | France | 95.1 /100 | #117 | Exceptional 98.0% |
| Iranians | 94.9 /100 | #118 | Exceptional 98.0% |
| Spanish | 94.8 /100 | #119 | Exceptional 98.0% |
| Immigrants | Croatia | 94.4 /100 | #120 | Exceptional 98.0% |
| Iroquois | 94.1 /100 | #121 | Exceptional 98.0% |