French American Indian vs Korean 5th Grade
COMPARE
French American Indian
Korean
5th Grade
5th Grade Comparison
French American Indians
Koreans
97.4%
5TH GRADE
70.5/ 100
METRIC RATING
156th/ 347
METRIC RANK
96.9%
5TH GRADE
1.6/ 100
METRIC RATING
244th/ 347
METRIC RANK
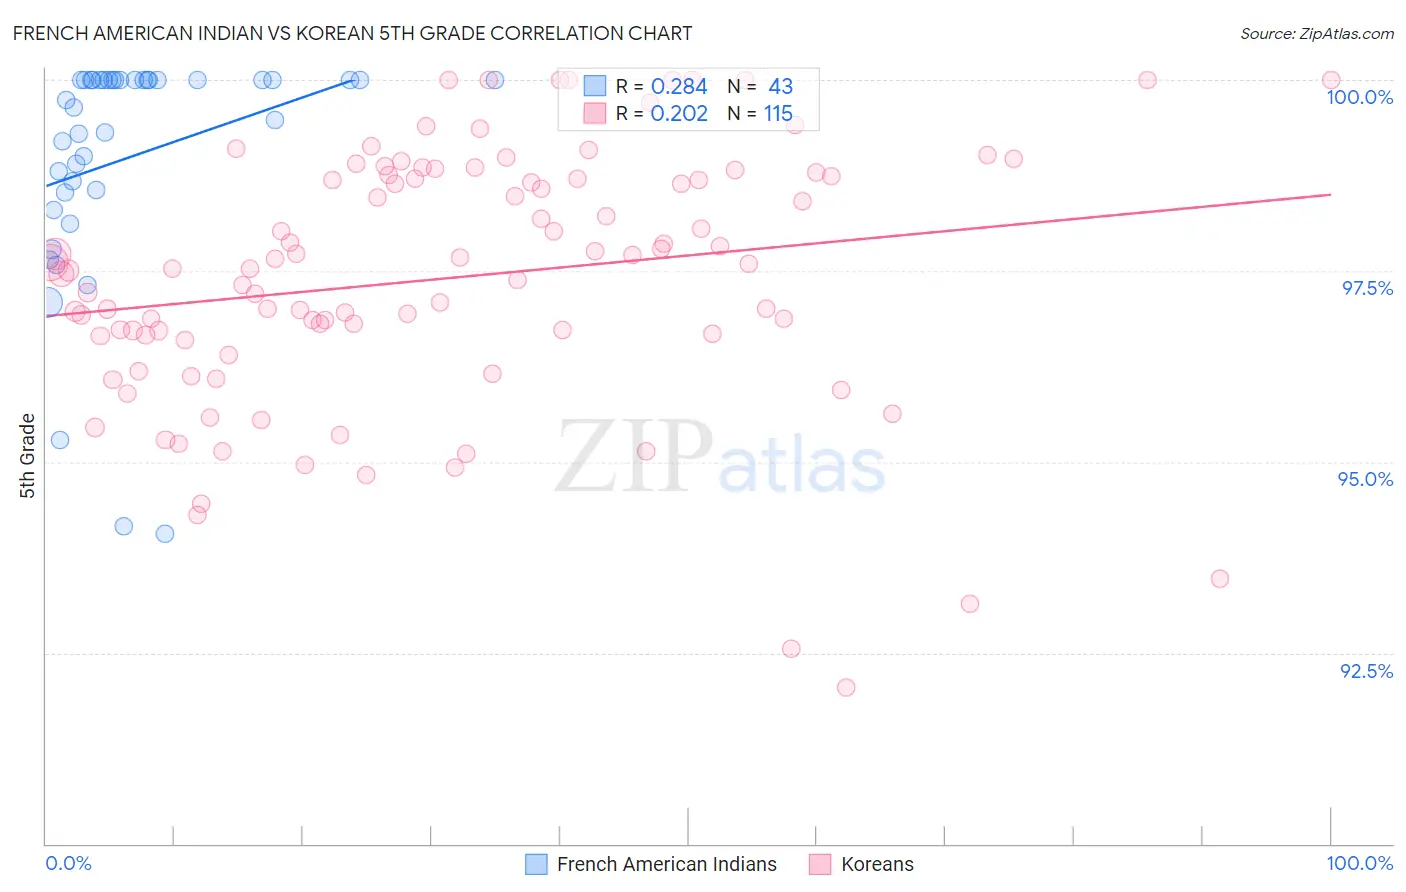
French American Indian vs Korean 5th Grade Correlation Chart
The statistical analysis conducted on geographies consisting of 131,974,854 people shows a weak positive correlation between the proportion of French American Indians and percentage of population with at least 5th grade education in the United States with a correlation coefficient (R) of 0.284 and weighted average of 97.4%. Similarly, the statistical analysis conducted on geographies consisting of 510,946,101 people shows a weak positive correlation between the proportion of Koreans and percentage of population with at least 5th grade education in the United States with a correlation coefficient (R) of 0.202 and weighted average of 96.9%, a difference of 0.52%.
5th Grade Correlation Summary
| Measurement | French American Indian | Korean |
| Minimum | 94.1% | 92.0% |
| Maximum | 100.0% | 100.0% |
| Range | 5.9% | 8.0% |
| Mean | 99.0% | 97.4% |
| Median | 99.7% | 97.5% |
| Interquartile 25% (IQ1) | 98.5% | 96.7% |
| Interquartile 75% (IQ3) | 100.0% | 98.7% |
| Interquartile Range (IQR) | 1.5% | 2.1% |
| Standard Deviation (Sample) | 1.5% | 1.7% |
| Standard Deviation (Population) | 1.5% | 1.7% |
Similar Demographics by 5th Grade
Demographics Similar to French American Indians by 5th Grade
In terms of 5th grade, the demographic groups most similar to French American Indians are Immigrants from Russia (97.4%, a difference of 0.0%), Immigrants from Bosnia and Herzegovina (97.4%, a difference of 0.0%), Immigrants from Jordan (97.4%, a difference of 0.0%), Albanian (97.4%, a difference of 0.010%), and Immigrants from Eastern Europe (97.4%, a difference of 0.020%).
| Demographics | Rating | Rank | 5th Grade |
| Hopi | 78.6 /100 | #149 | Good 97.5% |
| Immigrants | South Central Asia | 78.6 /100 | #150 | Good 97.5% |
| Immigrants | Eastern Europe | 75.0 /100 | #151 | Good 97.4% |
| Ute | 74.9 /100 | #152 | Good 97.4% |
| Alsatians | 74.3 /100 | #153 | Good 97.4% |
| Immigrants | Russia | 71.2 /100 | #154 | Good 97.4% |
| Immigrants | Bosnia and Herzegovina | 71.0 /100 | #155 | Good 97.4% |
| French American Indians | 70.5 /100 | #156 | Good 97.4% |
| Immigrants | Jordan | 70.4 /100 | #157 | Good 97.4% |
| Albanians | 68.3 /100 | #158 | Good 97.4% |
| Immigrants | Italy | 65.2 /100 | #159 | Good 97.4% |
| Marshallese | 61.2 /100 | #160 | Good 97.4% |
| Kenyans | 59.7 /100 | #161 | Average 97.4% |
| Immigrants | Iran | 59.5 /100 | #162 | Average 97.4% |
| Ugandans | 58.9 /100 | #163 | Average 97.4% |
Demographics Similar to Koreans by 5th Grade
In terms of 5th grade, the demographic groups most similar to Koreans are Immigrants from Costa Rica (96.9%, a difference of 0.0%), Immigrants from Eastern Africa (96.9%, a difference of 0.0%), Immigrants from Asia (96.9%, a difference of 0.010%), Asian (96.9%, a difference of 0.020%), and Nigerian (96.9%, a difference of 0.020%).
| Demographics | Rating | Rank | 5th Grade |
| Immigrants | Indonesia | 2.0 /100 | #237 | Tragic 96.9% |
| Asians | 2.0 /100 | #238 | Tragic 96.9% |
| Nigerians | 1.9 /100 | #239 | Tragic 96.9% |
| Indians (Asian) | 1.9 /100 | #240 | Tragic 96.9% |
| Immigrants | Asia | 1.7 /100 | #241 | Tragic 96.9% |
| Immigrants | Costa Rica | 1.6 /100 | #242 | Tragic 96.9% |
| Immigrants | Eastern Africa | 1.6 /100 | #243 | Tragic 96.9% |
| Koreans | 1.6 /100 | #244 | Tragic 96.9% |
| Colombians | 1.3 /100 | #245 | Tragic 96.9% |
| Ethiopians | 1.2 /100 | #246 | Tragic 96.9% |
| Immigrants | Africa | 1.1 /100 | #247 | Tragic 96.9% |
| U.S. Virgin Islanders | 1.1 /100 | #248 | Tragic 96.9% |
| Immigrants | Uruguay | 1.0 /100 | #249 | Tragic 96.9% |
| Immigrants | Liberia | 1.0 /100 | #250 | Tragic 96.9% |
| Bolivians | 0.9 /100 | #251 | Tragic 96.9% |