French American Indian vs Cajun No Schooling Completed
COMPARE
French American Indian
Cajun
No Schooling Completed
No Schooling Completed Comparison
French American Indians
Cajuns
2.1%
NO SCHOOLING COMPLETED
42.2/ 100
METRIC RATING
182nd/ 347
METRIC RANK
1.7%
NO SCHOOLING COMPLETED
99.5/ 100
METRIC RATING
72nd/ 347
METRIC RANK
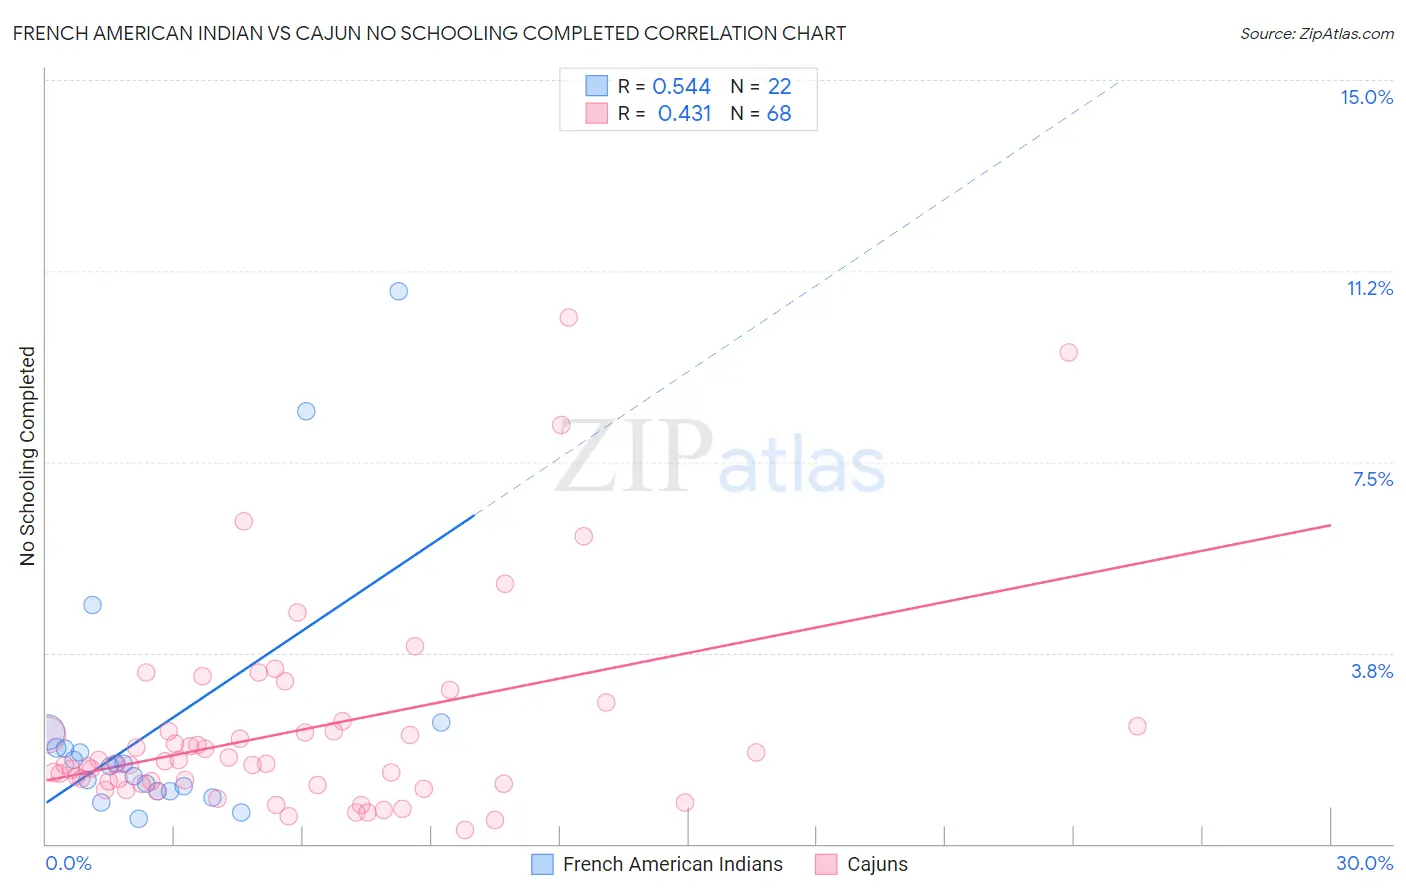
French American Indian vs Cajun No Schooling Completed Correlation Chart
The statistical analysis conducted on geographies consisting of 131,273,763 people shows a substantial positive correlation between the proportion of French American Indians and percentage of population with no schooling in the United States with a correlation coefficient (R) of 0.544 and weighted average of 2.1%. Similarly, the statistical analysis conducted on geographies consisting of 148,907,341 people shows a moderate positive correlation between the proportion of Cajuns and percentage of population with no schooling in the United States with a correlation coefficient (R) of 0.431 and weighted average of 1.7%, a difference of 22.9%.
No Schooling Completed Correlation Summary
| Measurement | French American Indian | Cajun |
| Minimum | 0.49% | 0.26% |
| Maximum | 10.9% | 10.3% |
| Range | 10.4% | 10.1% |
| Mean | 2.3% | 2.2% |
| Median | 1.5% | 1.6% |
| Interquartile 25% (IQ1) | 1.0% | 1.2% |
| Interquartile 75% (IQ3) | 1.9% | 2.3% |
| Interquartile Range (IQR) | 0.85% | 1.1% |
| Standard Deviation (Sample) | 2.6% | 2.0% |
| Standard Deviation (Population) | 2.5% | 2.0% |
Similar Demographics by No Schooling Completed
Demographics Similar to French American Indians by No Schooling Completed
In terms of no schooling completed, the demographic groups most similar to French American Indians are Immigrants from Taiwan (2.1%, a difference of 0.050%), Black/African American (2.1%, a difference of 0.10%), Pima (2.1%, a difference of 0.12%), Mongolian (2.1%, a difference of 0.19%), and Portuguese (2.1%, a difference of 0.23%).
| Demographics | Rating | Rank | No Schooling Completed |
| Arabs | 46.4 /100 | #175 | Average 2.1% |
| Panamanians | 45.2 /100 | #176 | Average 2.1% |
| Arapaho | 45.0 /100 | #177 | Average 2.1% |
| Pakistanis | 44.7 /100 | #178 | Average 2.1% |
| Immigrants | Kazakhstan | 44.3 /100 | #179 | Average 2.1% |
| Portuguese | 43.9 /100 | #180 | Average 2.1% |
| Immigrants | Taiwan | 42.6 /100 | #181 | Average 2.1% |
| French American Indians | 42.2 /100 | #182 | Average 2.1% |
| Blacks/African Americans | 41.4 /100 | #183 | Average 2.1% |
| Pima | 41.3 /100 | #184 | Average 2.1% |
| Mongolians | 40.8 /100 | #185 | Average 2.1% |
| Immigrants | Bosnia and Herzegovina | 38.6 /100 | #186 | Fair 2.1% |
| Navajo | 36.5 /100 | #187 | Fair 2.1% |
| Immigrants | Kenya | 36.2 /100 | #188 | Fair 2.1% |
| Immigrants | Egypt | 36.1 /100 | #189 | Fair 2.1% |
Demographics Similar to Cajuns by No Schooling Completed
In terms of no schooling completed, the demographic groups most similar to Cajuns are Immigrants from England (1.7%, a difference of 0.17%), Immigrants from India (1.7%, a difference of 0.48%), Zimbabwean (1.7%, a difference of 0.50%), Immigrants from Netherlands (1.7%, a difference of 0.51%), and Immigrants from Belgium (1.7%, a difference of 1.1%).
| Demographics | Rating | Rank | No Schooling Completed |
| Serbians | 99.7 /100 | #65 | Exceptional 1.7% |
| Canadians | 99.7 /100 | #66 | Exceptional 1.7% |
| Immigrants | Austria | 99.7 /100 | #67 | Exceptional 1.7% |
| Immigrants | Lithuania | 99.7 /100 | #68 | Exceptional 1.7% |
| Chickasaw | 99.6 /100 | #69 | Exceptional 1.7% |
| Immigrants | Netherlands | 99.6 /100 | #70 | Exceptional 1.7% |
| Immigrants | England | 99.5 /100 | #71 | Exceptional 1.7% |
| Cajuns | 99.5 /100 | #72 | Exceptional 1.7% |
| Immigrants | India | 99.4 /100 | #73 | Exceptional 1.7% |
| Zimbabweans | 99.4 /100 | #74 | Exceptional 1.7% |
| Immigrants | Belgium | 99.3 /100 | #75 | Exceptional 1.7% |
| Cherokee | 99.3 /100 | #76 | Exceptional 1.7% |
| Immigrants | Sweden | 99.3 /100 | #77 | Exceptional 1.7% |
| Delaware | 99.3 /100 | #78 | Exceptional 1.7% |
| Macedonians | 99.3 /100 | #79 | Exceptional 1.7% |