Fijian vs Peruvian 7th Grade
COMPARE
Fijian
Peruvian
7th Grade
7th Grade Comparison
Fijians
Peruvians
94.7%
7TH GRADE
0.0/ 100
METRIC RATING
293rd/ 347
METRIC RANK
95.1%
7TH GRADE
0.2/ 100
METRIC RATING
272nd/ 347
METRIC RANK
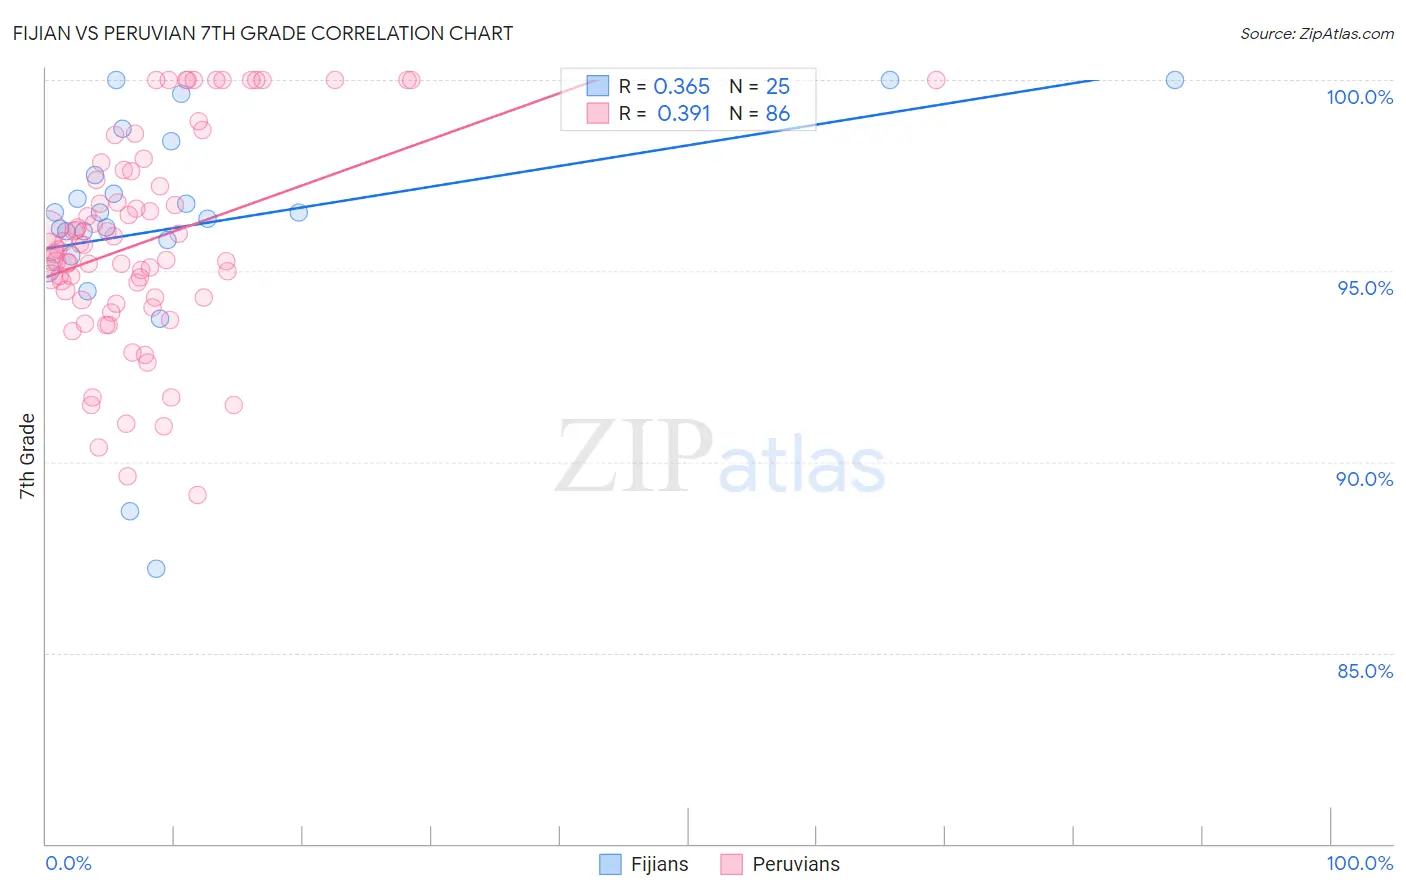
Fijian vs Peruvian 7th Grade Correlation Chart
The statistical analysis conducted on geographies consisting of 55,948,842 people shows a mild positive correlation between the proportion of Fijians and percentage of population with at least 7th grade education in the United States with a correlation coefficient (R) of 0.365 and weighted average of 94.7%. Similarly, the statistical analysis conducted on geographies consisting of 363,068,462 people shows a mild positive correlation between the proportion of Peruvians and percentage of population with at least 7th grade education in the United States with a correlation coefficient (R) of 0.391 and weighted average of 95.1%, a difference of 0.42%.
7th Grade Correlation Summary
| Measurement | Fijian | Peruvian |
| Minimum | 87.2% | 89.1% |
| Maximum | 100.0% | 100.0% |
| Range | 12.8% | 10.9% |
| Mean | 96.2% | 95.8% |
| Median | 96.5% | 95.6% |
| Interquartile 25% (IQ1) | 95.6% | 94.3% |
| Interquartile 75% (IQ3) | 97.9% | 97.6% |
| Interquartile Range (IQR) | 2.3% | 3.3% |
| Standard Deviation (Sample) | 3.0% | 2.7% |
| Standard Deviation (Population) | 3.0% | 2.7% |
Similar Demographics by 7th Grade
Demographics Similar to Fijians by 7th Grade
In terms of 7th grade, the demographic groups most similar to Fijians are Immigrants from West Indies (94.8%, a difference of 0.020%), Immigrants from Grenada (94.8%, a difference of 0.040%), Haitian (94.7%, a difference of 0.080%), Malaysian (94.8%, a difference of 0.090%), and Taiwanese (94.8%, a difference of 0.10%).
| Demographics | Rating | Rank | 7th Grade |
| Immigrants | Philippines | 0.0 /100 | #286 | Tragic 94.9% |
| Immigrants | Peru | 0.0 /100 | #287 | Tragic 94.9% |
| British West Indians | 0.0 /100 | #288 | Tragic 94.8% |
| Taiwanese | 0.0 /100 | #289 | Tragic 94.8% |
| Malaysians | 0.0 /100 | #290 | Tragic 94.8% |
| Immigrants | Grenada | 0.0 /100 | #291 | Tragic 94.8% |
| Immigrants | West Indies | 0.0 /100 | #292 | Tragic 94.8% |
| Fijians | 0.0 /100 | #293 | Tragic 94.7% |
| Haitians | 0.0 /100 | #294 | Tragic 94.7% |
| Yaqui | 0.0 /100 | #295 | Tragic 94.6% |
| Cubans | 0.0 /100 | #296 | Tragic 94.6% |
| Immigrants | South Eastern Asia | 0.0 /100 | #297 | Tragic 94.5% |
| Indonesians | 0.0 /100 | #298 | Tragic 94.5% |
| Bangladeshis | 0.0 /100 | #299 | Tragic 94.5% |
| Immigrants | Burma/Myanmar | 0.0 /100 | #300 | Tragic 94.5% |
Demographics Similar to Peruvians by 7th Grade
In terms of 7th grade, the demographic groups most similar to Peruvians are Houma (95.1%, a difference of 0.0%), Immigrants from South America (95.1%, a difference of 0.0%), Immigrants from Uzbekistan (95.1%, a difference of 0.0%), Immigrants from Western Africa (95.1%, a difference of 0.010%), and Immigrants from Colombia (95.1%, a difference of 0.010%).
| Demographics | Rating | Rank | 7th Grade |
| Immigrants | Uruguay | 0.3 /100 | #265 | Tragic 95.2% |
| Immigrants | Ghana | 0.3 /100 | #266 | Tragic 95.2% |
| Yuman | 0.3 /100 | #267 | Tragic 95.2% |
| Immigrants | Hong Kong | 0.3 /100 | #268 | Tragic 95.2% |
| Trinidadians and Tobagonians | 0.3 /100 | #269 | Tragic 95.2% |
| Houma | 0.2 /100 | #270 | Tragic 95.1% |
| Immigrants | South America | 0.2 /100 | #271 | Tragic 95.1% |
| Peruvians | 0.2 /100 | #272 | Tragic 95.1% |
| Immigrants | Uzbekistan | 0.2 /100 | #273 | Tragic 95.1% |
| Immigrants | Western Africa | 0.2 /100 | #274 | Tragic 95.1% |
| Immigrants | Colombia | 0.2 /100 | #275 | Tragic 95.1% |
| Immigrants | Thailand | 0.2 /100 | #276 | Tragic 95.1% |
| Immigrants | Afghanistan | 0.2 /100 | #277 | Tragic 95.1% |
| Immigrants | Trinidad and Tobago | 0.1 /100 | #278 | Tragic 95.1% |
| Barbadians | 0.1 /100 | #279 | Tragic 95.1% |