Fijian vs Nonimmigrants 5th Grade
COMPARE
Fijian
Nonimmigrants
5th Grade
5th Grade Comparison
Fijians
Nonimmigrants
96.6%
5TH GRADE
0.1/ 100
METRIC RATING
283rd/ 347
METRIC RANK
97.7%
5TH GRADE
97.3/ 100
METRIC RATING
108th/ 347
METRIC RANK
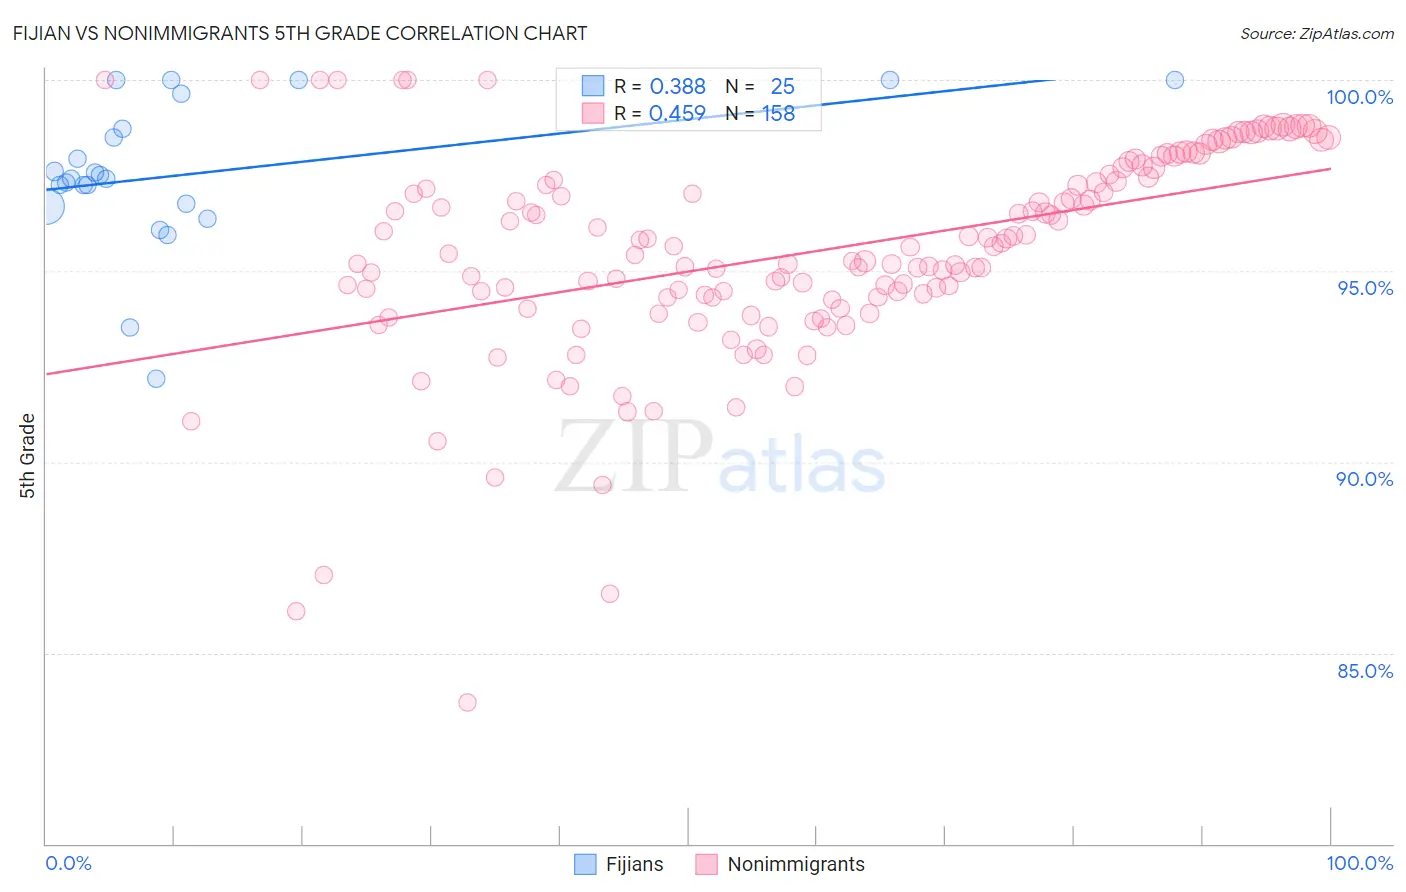
Fijian vs Nonimmigrants 5th Grade Correlation Chart
The statistical analysis conducted on geographies consisting of 55,948,842 people shows a mild positive correlation between the proportion of Fijians and percentage of population with at least 5th grade education in the United States with a correlation coefficient (R) of 0.388 and weighted average of 96.6%. Similarly, the statistical analysis conducted on geographies consisting of 585,374,516 people shows a moderate positive correlation between the proportion of Nonimmigrants and percentage of population with at least 5th grade education in the United States with a correlation coefficient (R) of 0.459 and weighted average of 97.7%, a difference of 1.1%.
5th Grade Correlation Summary
| Measurement | Fijian | Nonimmigrants |
| Minimum | 92.2% | 83.7% |
| Maximum | 100.0% | 100.0% |
| Range | 7.8% | 16.3% |
| Mean | 97.6% | 95.5% |
| Median | 97.4% | 95.6% |
| Interquartile 25% (IQ1) | 96.7% | 94.3% |
| Interquartile 75% (IQ3) | 99.2% | 97.5% |
| Interquartile Range (IQR) | 2.4% | 3.2% |
| Standard Deviation (Sample) | 1.9% | 2.8% |
| Standard Deviation (Population) | 1.9% | 2.7% |
Similar Demographics by 5th Grade
Demographics Similar to Fijians by 5th Grade
In terms of 5th grade, the demographic groups most similar to Fijians are Immigrants from Western Africa (96.6%, a difference of 0.0%), Houma (96.6%, a difference of 0.0%), Barbadian (96.6%, a difference of 0.0%), Immigrants from Trinidad and Tobago (96.6%, a difference of 0.0%), and Immigrants from Philippines (96.6%, a difference of 0.010%).
| Demographics | Rating | Rank | 5th Grade |
| Cubans | 0.1 /100 | #276 | Tragic 96.6% |
| Immigrants | Bolivia | 0.1 /100 | #277 | Tragic 96.6% |
| Immigrants | Ghana | 0.1 /100 | #278 | Tragic 96.6% |
| Immigrants | Philippines | 0.1 /100 | #279 | Tragic 96.6% |
| Immigrants | Western Africa | 0.1 /100 | #280 | Tragic 96.6% |
| Houma | 0.1 /100 | #281 | Tragic 96.6% |
| Barbadians | 0.1 /100 | #282 | Tragic 96.6% |
| Fijians | 0.1 /100 | #283 | Tragic 96.6% |
| Immigrants | Trinidad and Tobago | 0.1 /100 | #284 | Tragic 96.6% |
| Immigrants | St. Vincent and the Grenadines | 0.1 /100 | #285 | Tragic 96.6% |
| Immigrants | Thailand | 0.1 /100 | #286 | Tragic 96.6% |
| Immigrants | Afghanistan | 0.1 /100 | #287 | Tragic 96.6% |
| Immigrants | Barbados | 0.0 /100 | #288 | Tragic 96.6% |
| Immigrants | West Indies | 0.0 /100 | #289 | Tragic 96.5% |
| British West Indians | 0.0 /100 | #290 | Tragic 96.5% |
Demographics Similar to Nonimmigrants by 5th Grade
In terms of 5th grade, the demographic groups most similar to Nonimmigrants are Bhutanese (97.7%, a difference of 0.010%), Immigrants from Czechoslovakia (97.7%, a difference of 0.010%), Immigrants from Singapore (97.7%, a difference of 0.010%), Immigrants from Latvia (97.7%, a difference of 0.010%), and Thai (97.7%, a difference of 0.010%).
| Demographics | Rating | Rank | 5th Grade |
| South Africans | 98.3 /100 | #101 | Exceptional 97.7% |
| Choctaw | 98.0 /100 | #102 | Exceptional 97.7% |
| Cheyenne | 97.9 /100 | #103 | Exceptional 97.7% |
| German Russians | 97.8 /100 | #104 | Exceptional 97.7% |
| Bhutanese | 97.6 /100 | #105 | Exceptional 97.7% |
| Immigrants | Czechoslovakia | 97.5 /100 | #106 | Exceptional 97.7% |
| Immigrants | Singapore | 97.5 /100 | #107 | Exceptional 97.7% |
| Immigrants | Nonimmigrants | 97.3 /100 | #108 | Exceptional 97.7% |
| Immigrants | Latvia | 97.1 /100 | #109 | Exceptional 97.7% |
| Thais | 96.9 /100 | #110 | Exceptional 97.7% |
| Menominee | 96.3 /100 | #111 | Exceptional 97.7% |
| Immigrants | Switzerland | 96.0 /100 | #112 | Exceptional 97.7% |
| Iroquois | 95.9 /100 | #113 | Exceptional 97.7% |
| Lebanese | 95.7 /100 | #114 | Exceptional 97.6% |
| Okinawans | 95.7 /100 | #115 | Exceptional 97.6% |