Ethiopian vs Guatemalan 7th Grade
COMPARE
Ethiopian
Guatemalan
7th Grade
7th Grade Comparison
Ethiopians
Guatemalans
95.4%
7TH GRADE
1.5/ 100
METRIC RATING
246th/ 347
METRIC RANK
91.7%
7TH GRADE
0.0/ 100
METRIC RATING
341st/ 347
METRIC RANK
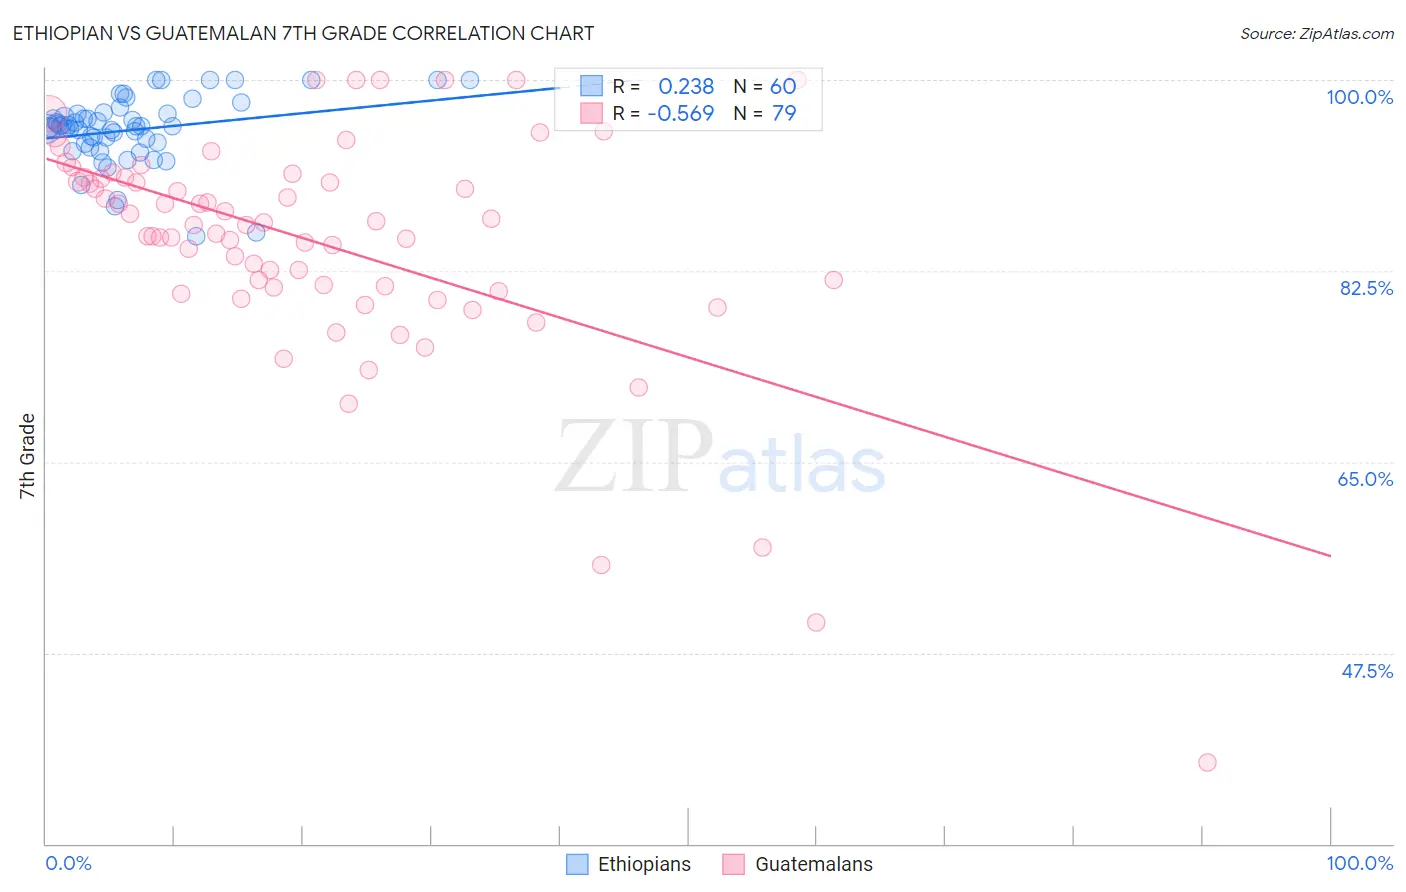
Ethiopian vs Guatemalan 7th Grade Correlation Chart
The statistical analysis conducted on geographies consisting of 223,161,778 people shows a weak positive correlation between the proportion of Ethiopians and percentage of population with at least 7th grade education in the United States with a correlation coefficient (R) of 0.238 and weighted average of 95.4%. Similarly, the statistical analysis conducted on geographies consisting of 409,566,618 people shows a substantial negative correlation between the proportion of Guatemalans and percentage of population with at least 7th grade education in the United States with a correlation coefficient (R) of -0.569 and weighted average of 91.7%, a difference of 4.1%.
7th Grade Correlation Summary
| Measurement | Ethiopian | Guatemalan |
| Minimum | 85.7% | 37.5% |
| Maximum | 100.0% | 100.0% |
| Range | 14.3% | 62.5% |
| Mean | 95.4% | 85.1% |
| Median | 95.7% | 86.8% |
| Interquartile 25% (IQ1) | 94.2% | 81.0% |
| Interquartile 75% (IQ3) | 96.9% | 91.1% |
| Interquartile Range (IQR) | 2.7% | 10.1% |
| Standard Deviation (Sample) | 3.1% | 10.8% |
| Standard Deviation (Population) | 3.1% | 10.7% |
Similar Demographics by 7th Grade
Demographics Similar to Ethiopians by 7th Grade
In terms of 7th grade, the demographic groups most similar to Ethiopians are Uruguayan (95.4%, a difference of 0.010%), Immigrants from Middle Africa (95.4%, a difference of 0.010%), U.S. Virgin Islander (95.4%, a difference of 0.020%), Tongan (95.4%, a difference of 0.020%), and Immigrants from Senegal (95.5%, a difference of 0.040%).
| Demographics | Rating | Rank | 7th Grade |
| Jamaicans | 2.2 /100 | #239 | Tragic 95.5% |
| Immigrants | Sierra Leone | 2.0 /100 | #240 | Tragic 95.5% |
| South American Indians | 2.0 /100 | #241 | Tragic 95.5% |
| Immigrants | Senegal | 1.9 /100 | #242 | Tragic 95.5% |
| U.S. Virgin Islanders | 1.6 /100 | #243 | Tragic 95.4% |
| Uruguayans | 1.6 /100 | #244 | Tragic 95.4% |
| Immigrants | Middle Africa | 1.5 /100 | #245 | Tragic 95.4% |
| Ethiopians | 1.5 /100 | #246 | Tragic 95.4% |
| Tongans | 1.3 /100 | #247 | Tragic 95.4% |
| Paiute | 1.2 /100 | #248 | Tragic 95.4% |
| Bolivians | 1.1 /100 | #249 | Tragic 95.4% |
| Immigrants | Cameroon | 0.9 /100 | #250 | Tragic 95.4% |
| Immigrants | Jamaica | 0.9 /100 | #251 | Tragic 95.4% |
| Immigrants | Ethiopia | 0.9 /100 | #252 | Tragic 95.3% |
| Somalis | 0.9 /100 | #253 | Tragic 95.3% |
Demographics Similar to Guatemalans by 7th Grade
In terms of 7th grade, the demographic groups most similar to Guatemalans are Yakama (91.7%, a difference of 0.020%), Mexican (91.9%, a difference of 0.21%), Salvadoran (91.5%, a difference of 0.27%), Immigrants from Guatemala (91.3%, a difference of 0.43%), and Central American (92.1%, a difference of 0.46%).
| Demographics | Rating | Rank | 7th Grade |
| Immigrants | Armenia | 0.0 /100 | #333 | Tragic 92.7% |
| Immigrants | Yemen | 0.0 /100 | #334 | Tragic 92.6% |
| Mexican American Indians | 0.0 /100 | #335 | Tragic 92.6% |
| Immigrants | Honduras | 0.0 /100 | #336 | Tragic 92.5% |
| Immigrants | Latin America | 0.0 /100 | #337 | Tragic 92.2% |
| Central Americans | 0.0 /100 | #338 | Tragic 92.1% |
| Mexicans | 0.0 /100 | #339 | Tragic 91.9% |
| Yakama | 0.0 /100 | #340 | Tragic 91.7% |
| Guatemalans | 0.0 /100 | #341 | Tragic 91.7% |
| Salvadorans | 0.0 /100 | #342 | Tragic 91.5% |
| Immigrants | Guatemala | 0.0 /100 | #343 | Tragic 91.3% |
| Immigrants | Central America | 0.0 /100 | #344 | Tragic 91.0% |
| Immigrants | El Salvador | 0.0 /100 | #345 | Tragic 90.9% |
| Immigrants | Mexico | 0.0 /100 | #346 | Tragic 90.7% |
| Spanish American Indians | 0.0 /100 | #347 | Tragic 90.3% |