Estonian vs Central American 5th Grade
COMPARE
Estonian
Central American
5th Grade
5th Grade Comparison
Estonians
Central Americans
98.0%
5TH GRADE
99.8/ 100
METRIC RATING
49th/ 347
METRIC RANK
95.1%
5TH GRADE
0.0/ 100
METRIC RATING
337th/ 347
METRIC RANK
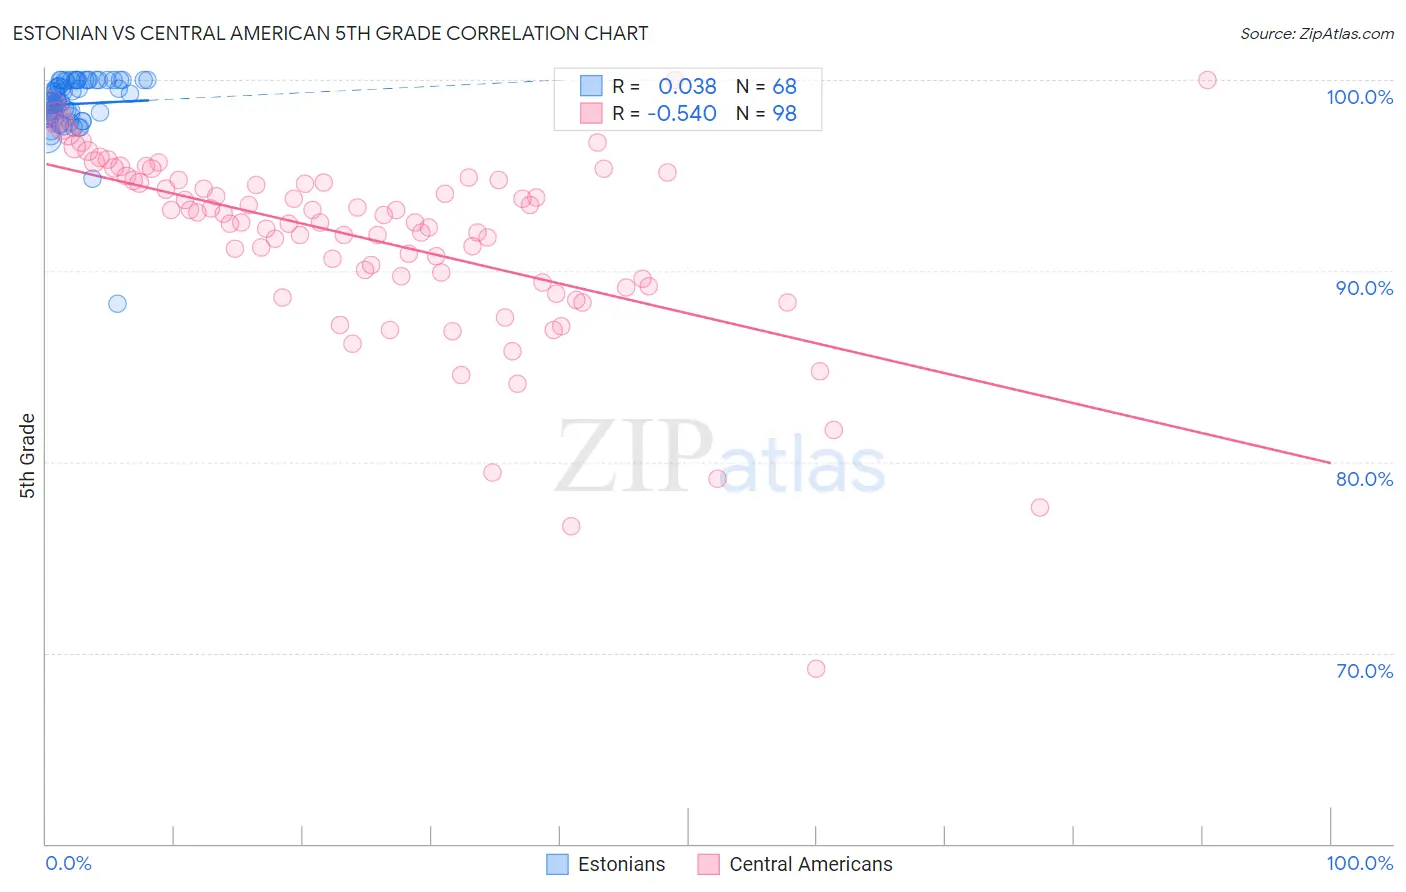
Estonian vs Central American 5th Grade Correlation Chart
The statistical analysis conducted on geographies consisting of 123,528,404 people shows no correlation between the proportion of Estonians and percentage of population with at least 5th grade education in the United States with a correlation coefficient (R) of 0.038 and weighted average of 98.0%. Similarly, the statistical analysis conducted on geographies consisting of 504,619,198 people shows a substantial negative correlation between the proportion of Central Americans and percentage of population with at least 5th grade education in the United States with a correlation coefficient (R) of -0.540 and weighted average of 95.1%, a difference of 3.1%.
5th Grade Correlation Summary
| Measurement | Estonian | Central American |
| Minimum | 88.3% | 69.2% |
| Maximum | 100.0% | 100.0% |
| Range | 11.7% | 30.8% |
| Mean | 98.7% | 91.5% |
| Median | 98.9% | 92.6% |
| Interquartile 25% (IQ1) | 98.1% | 89.4% |
| Interquartile 75% (IQ3) | 100.0% | 94.7% |
| Interquartile Range (IQR) | 1.9% | 5.3% |
| Standard Deviation (Sample) | 1.7% | 5.0% |
| Standard Deviation (Population) | 1.7% | 5.0% |
Similar Demographics by 5th Grade
Demographics Similar to Estonians by 5th Grade
In terms of 5th grade, the demographic groups most similar to Estonians are Immigrants from Scotland (98.0%, a difference of 0.0%), Celtic (98.0%, a difference of 0.0%), Bulgarian (98.0%, a difference of 0.010%), Maltese (98.0%, a difference of 0.010%), and Slavic (98.0%, a difference of 0.010%).
| Demographics | Rating | Rank | 5th Grade |
| Northern Europeans | 99.9 /100 | #42 | Exceptional 98.0% |
| Ottawa | 99.9 /100 | #43 | Exceptional 98.0% |
| Aleuts | 99.9 /100 | #44 | Exceptional 98.0% |
| Czechoslovakians | 99.9 /100 | #45 | Exceptional 98.0% |
| Arapaho | 99.9 /100 | #46 | Exceptional 98.0% |
| Native Hawaiians | 99.9 /100 | #47 | Exceptional 98.0% |
| Bulgarians | 99.8 /100 | #48 | Exceptional 98.0% |
| Estonians | 99.8 /100 | #49 | Exceptional 98.0% |
| Immigrants | Scotland | 99.8 /100 | #50 | Exceptional 98.0% |
| Celtics | 99.8 /100 | #51 | Exceptional 98.0% |
| Maltese | 99.8 /100 | #52 | Exceptional 98.0% |
| Slavs | 99.8 /100 | #53 | Exceptional 98.0% |
| Australians | 99.8 /100 | #54 | Exceptional 98.0% |
| Creek | 99.8 /100 | #55 | Exceptional 98.0% |
| Greeks | 99.8 /100 | #56 | Exceptional 97.9% |
Demographics Similar to Central Americans by 5th Grade
In terms of 5th grade, the demographic groups most similar to Central Americans are Immigrants from the Azores (95.1%, a difference of 0.070%), Immigrants from Cabo Verde (94.9%, a difference of 0.16%), Mexican (95.2%, a difference of 0.17%), Nepalese (95.2%, a difference of 0.19%), and Immigrants from Yemen (94.9%, a difference of 0.21%).
| Demographics | Rating | Rank | 5th Grade |
| Immigrants | Armenia | 0.0 /100 | #330 | Tragic 95.4% |
| Immigrants | Honduras | 0.0 /100 | #331 | Tragic 95.4% |
| Immigrants | Dominican Republic | 0.0 /100 | #332 | Tragic 95.3% |
| Immigrants | Latin America | 0.0 /100 | #333 | Tragic 95.3% |
| Nepalese | 0.0 /100 | #334 | Tragic 95.2% |
| Mexicans | 0.0 /100 | #335 | Tragic 95.2% |
| Immigrants | Azores | 0.0 /100 | #336 | Tragic 95.1% |
| Central Americans | 0.0 /100 | #337 | Tragic 95.1% |
| Immigrants | Cabo Verde | 0.0 /100 | #338 | Tragic 94.9% |
| Immigrants | Yemen | 0.0 /100 | #339 | Tragic 94.9% |
| Guatemalans | 0.0 /100 | #340 | Tragic 94.8% |
| Yakama | 0.0 /100 | #341 | Tragic 94.8% |
| Immigrants | Central America | 0.0 /100 | #342 | Tragic 94.7% |
| Salvadorans | 0.0 /100 | #343 | Tragic 94.6% |
| Immigrants | Mexico | 0.0 /100 | #344 | Tragic 94.6% |