English vs Immigrants from Thailand 9th Grade
COMPARE
English
Immigrants from Thailand
9th Grade
9th Grade Comparison
English
Immigrants from Thailand
96.6%
9TH GRADE
100.0/ 100
METRIC RATING
12th/ 347
METRIC RANK
93.9%
9TH GRADE
0.5/ 100
METRIC RATING
258th/ 347
METRIC RANK
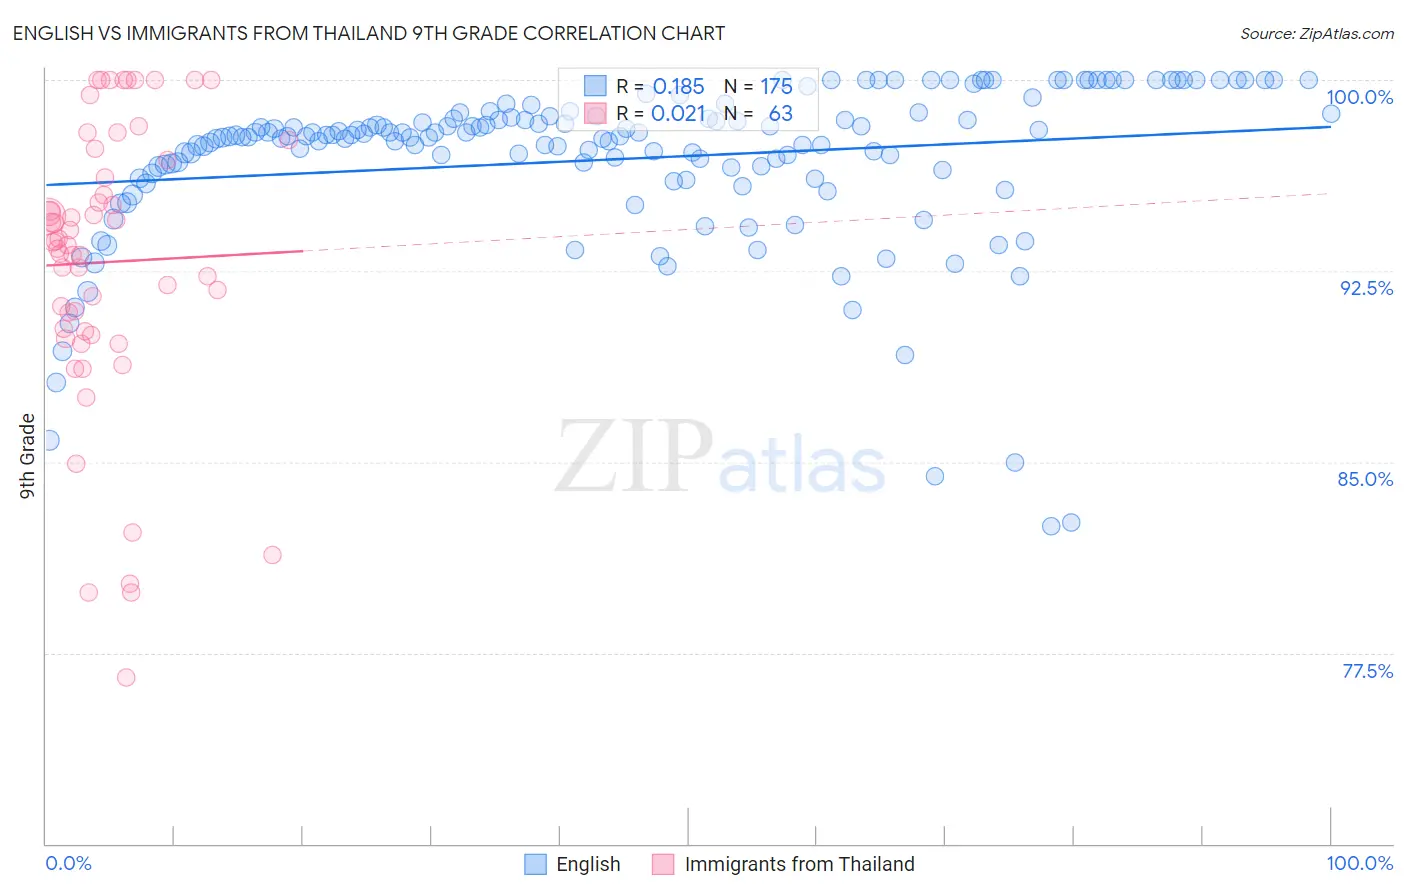
English vs Immigrants from Thailand 9th Grade Correlation Chart
The statistical analysis conducted on geographies consisting of 579,981,193 people shows a poor positive correlation between the proportion of English and percentage of population with at least 9th grade education in the United States with a correlation coefficient (R) of 0.185 and weighted average of 96.6%. Similarly, the statistical analysis conducted on geographies consisting of 317,022,438 people shows no correlation between the proportion of Immigrants from Thailand and percentage of population with at least 9th grade education in the United States with a correlation coefficient (R) of 0.021 and weighted average of 93.9%, a difference of 2.8%.
9th Grade Correlation Summary
| Measurement | English | Immigrants from Thailand |
| Minimum | 82.5% | 76.6% |
| Maximum | 100.0% | 100.0% |
| Range | 17.5% | 23.4% |
| Mean | 96.9% | 92.8% |
| Median | 97.8% | 93.6% |
| Interquartile 25% (IQ1) | 96.3% | 90.1% |
| Interquartile 75% (IQ3) | 98.6% | 96.9% |
| Interquartile Range (IQR) | 2.2% | 6.7% |
| Standard Deviation (Sample) | 3.3% | 5.6% |
| Standard Deviation (Population) | 3.3% | 5.5% |
Similar Demographics by 9th Grade
Demographics Similar to English by 9th Grade
In terms of 9th grade, the demographic groups most similar to English are Lithuanian (96.6%, a difference of 0.020%), Finnish (96.6%, a difference of 0.020%), Danish (96.5%, a difference of 0.040%), Scottish (96.5%, a difference of 0.050%), and Irish (96.5%, a difference of 0.050%).
| Demographics | Rating | Rank | 9th Grade |
| Swedes | 100.0 /100 | #5 | Exceptional 96.7% |
| Poles | 100.0 /100 | #6 | Exceptional 96.7% |
| Carpatho Rusyns | 100.0 /100 | #7 | Exceptional 96.7% |
| Germans | 100.0 /100 | #8 | Exceptional 96.7% |
| Tlingit-Haida | 100.0 /100 | #9 | Exceptional 96.6% |
| Lithuanians | 100.0 /100 | #10 | Exceptional 96.6% |
| Finns | 100.0 /100 | #11 | Exceptional 96.6% |
| English | 100.0 /100 | #12 | Exceptional 96.6% |
| Danes | 100.0 /100 | #13 | Exceptional 96.5% |
| Scottish | 100.0 /100 | #14 | Exceptional 96.5% |
| Irish | 100.0 /100 | #15 | Exceptional 96.5% |
| Croatians | 100.0 /100 | #16 | Exceptional 96.5% |
| Dutch | 100.0 /100 | #17 | Exceptional 96.5% |
| Scandinavians | 100.0 /100 | #18 | Exceptional 96.5% |
| Welsh | 100.0 /100 | #19 | Exceptional 96.4% |
Demographics Similar to Immigrants from Thailand by 9th Grade
In terms of 9th grade, the demographic groups most similar to Immigrants from Thailand are Ghanaian (93.9%, a difference of 0.0%), Immigrants from Costa Rica (94.0%, a difference of 0.010%), Pima (93.9%, a difference of 0.010%), Immigrants from Afghanistan (94.0%, a difference of 0.020%), and South American (93.9%, a difference of 0.020%).
| Demographics | Rating | Rank | 9th Grade |
| Jamaicans | 1.0 /100 | #251 | Tragic 94.1% |
| Immigrants | Senegal | 0.9 /100 | #252 | Tragic 94.1% |
| Colombians | 0.8 /100 | #253 | Tragic 94.0% |
| U.S. Virgin Islanders | 0.7 /100 | #254 | Tragic 94.0% |
| Immigrants | Nigeria | 0.6 /100 | #255 | Tragic 94.0% |
| Immigrants | Afghanistan | 0.5 /100 | #256 | Tragic 94.0% |
| Immigrants | Costa Rica | 0.5 /100 | #257 | Tragic 94.0% |
| Immigrants | Thailand | 0.5 /100 | #258 | Tragic 93.9% |
| Ghanaians | 0.5 /100 | #259 | Tragic 93.9% |
| Pima | 0.4 /100 | #260 | Tragic 93.9% |
| South Americans | 0.4 /100 | #261 | Tragic 93.9% |
| Immigrants | Jamaica | 0.4 /100 | #262 | Tragic 93.9% |
| Immigrants | Uzbekistan | 0.4 /100 | #263 | Tragic 93.9% |
| Immigrants | Congo | 0.4 /100 | #264 | Tragic 93.9% |
| Natives/Alaskans | 0.4 /100 | #265 | Tragic 93.9% |