English vs Immigrants from Nicaragua 12th Grade, No Diploma
COMPARE
English
Immigrants from Nicaragua
12th Grade, No Diploma
12th Grade, No Diploma Comparison
English
Immigrants from Nicaragua
93.0%
12TH GRADE, NO DIPLOMA
99.9/ 100
METRIC RATING
35th/ 347
METRIC RANK
86.6%
12TH GRADE, NO DIPLOMA
0.0/ 100
METRIC RATING
320th/ 347
METRIC RANK
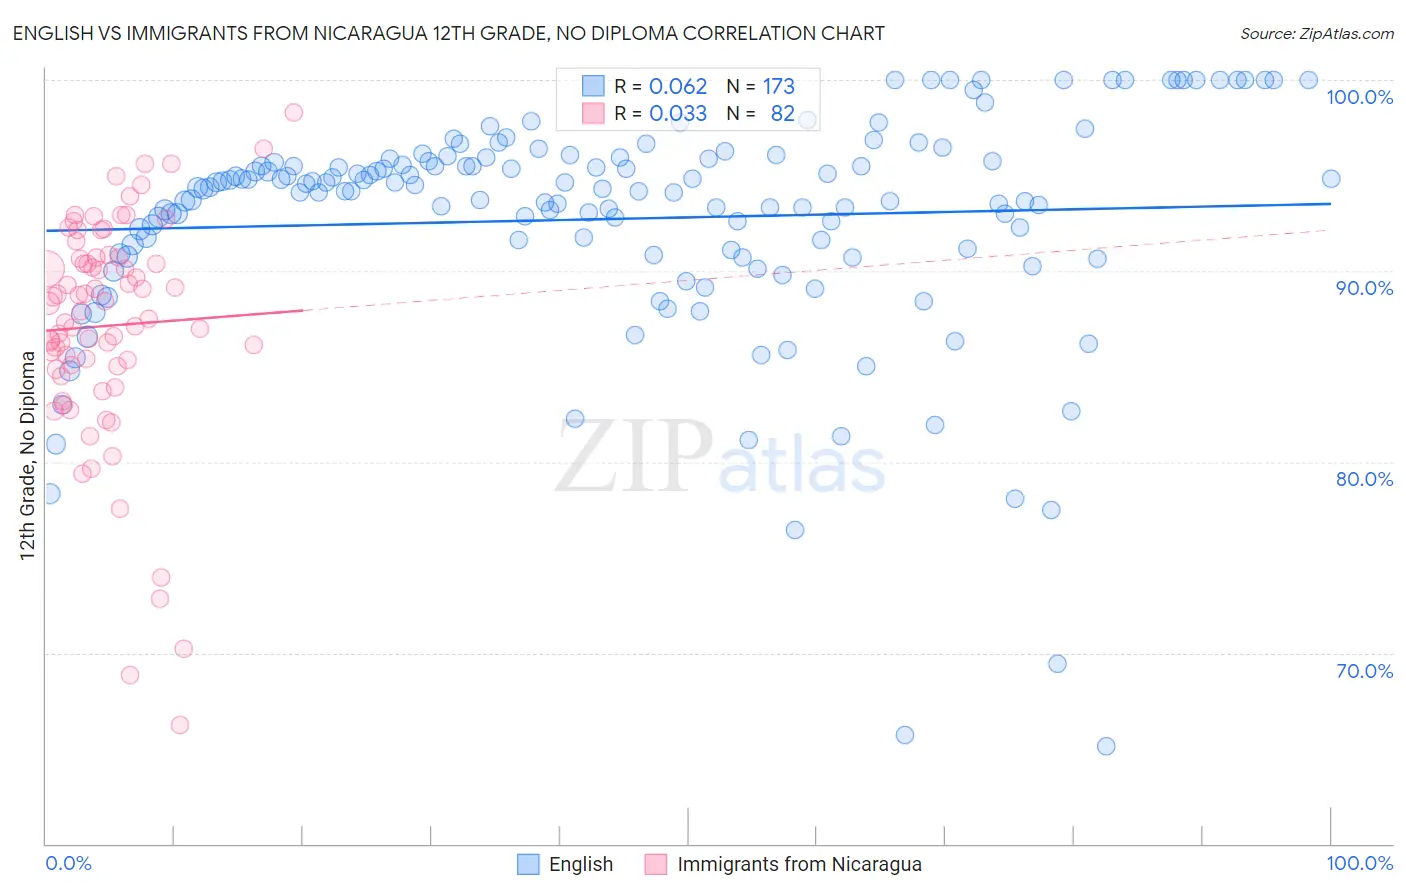
English vs Immigrants from Nicaragua 12th Grade, No Diploma Correlation Chart
The statistical analysis conducted on geographies consisting of 579,978,949 people shows a slight positive correlation between the proportion of English and percentage of population with at least 12th grade (no diploma) education in the United States with a correlation coefficient (R) of 0.062 and weighted average of 93.0%. Similarly, the statistical analysis conducted on geographies consisting of 236,340,506 people shows no correlation between the proportion of Immigrants from Nicaragua and percentage of population with at least 12th grade (no diploma) education in the United States with a correlation coefficient (R) of 0.033 and weighted average of 86.6%, a difference of 7.4%.
12th Grade, No Diploma Correlation Summary
| Measurement | English | Immigrants from Nicaragua |
| Minimum | 65.1% | 66.2% |
| Maximum | 100.0% | 98.3% |
| Range | 34.9% | 32.1% |
| Mean | 92.7% | 87.1% |
| Median | 94.3% | 88.1% |
| Interquartile 25% (IQ1) | 90.9% | 85.0% |
| Interquartile 75% (IQ3) | 95.8% | 90.7% |
| Interquartile Range (IQR) | 4.9% | 5.7% |
| Standard Deviation (Sample) | 6.0% | 6.0% |
| Standard Deviation (Population) | 5.9% | 5.9% |
Similar Demographics by 12th Grade, No Diploma
Demographics Similar to English by 12th Grade, No Diploma
In terms of 12th grade, no diploma, the demographic groups most similar to English are Okinawan (93.0%, a difference of 0.0%), Scottish (93.0%, a difference of 0.0%), Irish (93.0%, a difference of 0.010%), Immigrants from Scotland (93.0%, a difference of 0.030%), and Tlingit-Haida (93.0%, a difference of 0.040%).
| Demographics | Rating | Rank | 12th Grade, No Diploma |
| Immigrants | Northern Europe | 99.9 /100 | #28 | Exceptional 93.1% |
| Iranians | 99.9 /100 | #29 | Exceptional 93.1% |
| Immigrants | Lithuania | 99.9 /100 | #30 | Exceptional 93.1% |
| Immigrants | Ireland | 99.9 /100 | #31 | Exceptional 93.1% |
| Europeans | 99.9 /100 | #32 | Exceptional 93.1% |
| Immigrants | Scotland | 99.9 /100 | #33 | Exceptional 93.0% |
| Okinawans | 99.9 /100 | #34 | Exceptional 93.0% |
| English | 99.9 /100 | #35 | Exceptional 93.0% |
| Scottish | 99.9 /100 | #36 | Exceptional 93.0% |
| Irish | 99.9 /100 | #37 | Exceptional 93.0% |
| Tlingit-Haida | 99.8 /100 | #38 | Exceptional 93.0% |
| Immigrants | Austria | 99.8 /100 | #39 | Exceptional 93.0% |
| Turks | 99.8 /100 | #40 | Exceptional 93.0% |
| Bhutanese | 99.8 /100 | #41 | Exceptional 93.0% |
| Immigrants | Australia | 99.8 /100 | #42 | Exceptional 92.9% |
Demographics Similar to Immigrants from Nicaragua by 12th Grade, No Diploma
In terms of 12th grade, no diploma, the demographic groups most similar to Immigrants from Nicaragua are Puerto Rican (86.5%, a difference of 0.030%), Central American Indian (86.5%, a difference of 0.10%), Yuman (86.5%, a difference of 0.11%), Immigrants from Belize (87.0%, a difference of 0.46%), and Belizean (87.0%, a difference of 0.54%).
| Demographics | Rating | Rank | 12th Grade, No Diploma |
| Immigrants | Caribbean | 0.0 /100 | #313 | Tragic 87.4% |
| Cape Verdeans | 0.0 /100 | #314 | Tragic 87.4% |
| Nicaraguans | 0.0 /100 | #315 | Tragic 87.3% |
| Apache | 0.0 /100 | #316 | Tragic 87.3% |
| Navajo | 0.0 /100 | #317 | Tragic 87.1% |
| Belizeans | 0.0 /100 | #318 | Tragic 87.0% |
| Immigrants | Belize | 0.0 /100 | #319 | Tragic 87.0% |
| Immigrants | Nicaragua | 0.0 /100 | #320 | Tragic 86.6% |
| Puerto Ricans | 0.0 /100 | #321 | Tragic 86.5% |
| Central American Indians | 0.0 /100 | #322 | Tragic 86.5% |
| Yuman | 0.0 /100 | #323 | Tragic 86.5% |
| Immigrants | Cabo Verde | 0.0 /100 | #324 | Tragic 85.8% |
| Mexican American Indians | 0.0 /100 | #325 | Tragic 85.7% |
| Dominicans | 0.0 /100 | #326 | Tragic 85.7% |
| Lumbee | 0.0 /100 | #327 | Tragic 85.7% |