Ecuadorian vs Costa Rican 12th Grade, No Diploma
COMPARE
Ecuadorian
Costa Rican
12th Grade, No Diploma
12th Grade, No Diploma Comparison
Ecuadorians
Costa Ricans
88.0%
12TH GRADE, NO DIPLOMA
0.0/ 100
METRIC RATING
302nd/ 347
METRIC RANK
90.5%
12TH GRADE, NO DIPLOMA
9.4/ 100
METRIC RATING
213th/ 347
METRIC RANK
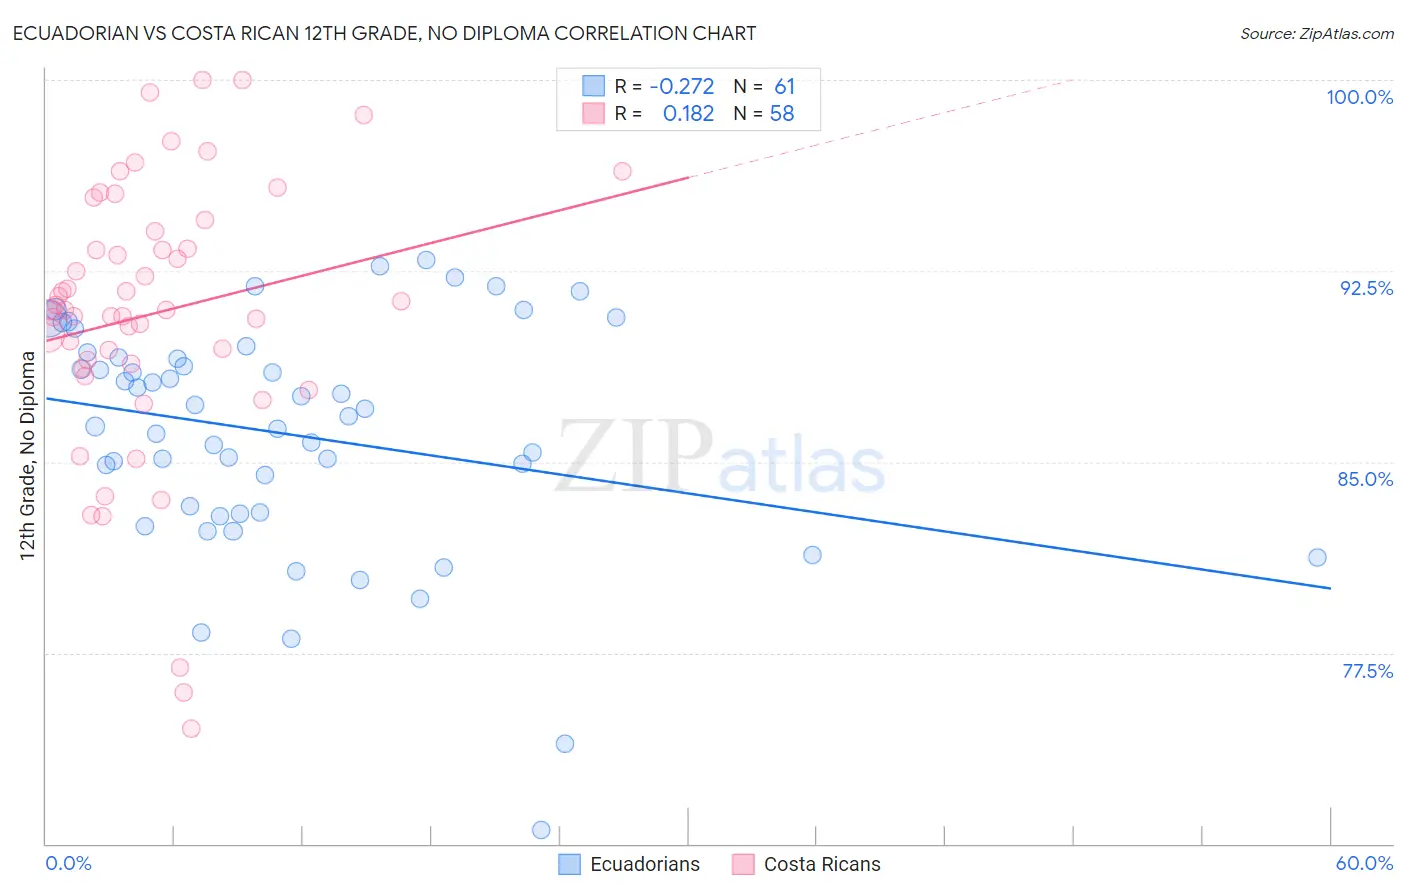
Ecuadorian vs Costa Rican 12th Grade, No Diploma Correlation Chart
The statistical analysis conducted on geographies consisting of 317,753,005 people shows a weak negative correlation between the proportion of Ecuadorians and percentage of population with at least 12th grade (no diploma) education in the United States with a correlation coefficient (R) of -0.272 and weighted average of 88.0%. Similarly, the statistical analysis conducted on geographies consisting of 253,601,730 people shows a poor positive correlation between the proportion of Costa Ricans and percentage of population with at least 12th grade (no diploma) education in the United States with a correlation coefficient (R) of 0.182 and weighted average of 90.5%, a difference of 2.8%.
12th Grade, No Diploma Correlation Summary
| Measurement | Ecuadorian | Costa Rican |
| Minimum | 70.5% | 74.5% |
| Maximum | 92.9% | 100.0% |
| Range | 22.4% | 25.5% |
| Mean | 86.1% | 90.8% |
| Median | 86.8% | 91.0% |
| Interquartile 25% (IQ1) | 83.0% | 88.9% |
| Interquartile 75% (IQ3) | 89.2% | 94.1% |
| Interquartile Range (IQR) | 6.2% | 5.2% |
| Standard Deviation (Sample) | 4.6% | 5.4% |
| Standard Deviation (Population) | 4.5% | 5.4% |
Similar Demographics by 12th Grade, No Diploma
Demographics Similar to Ecuadorians by 12th Grade, No Diploma
In terms of 12th grade, no diploma, the demographic groups most similar to Ecuadorians are Immigrants from Guyana (88.1%, a difference of 0.030%), Immigrants from Cambodia (88.1%, a difference of 0.030%), Nepalese (88.1%, a difference of 0.080%), Immigrants from Bangladesh (88.0%, a difference of 0.10%), and Immigrants from Haiti (88.2%, a difference of 0.12%).
| Demographics | Rating | Rank | 12th Grade, No Diploma |
| Immigrants | Immigrants | 0.0 /100 | #295 | Tragic 88.2% |
| Fijians | 0.0 /100 | #296 | Tragic 88.2% |
| Pueblo | 0.0 /100 | #297 | Tragic 88.2% |
| Immigrants | Haiti | 0.0 /100 | #298 | Tragic 88.2% |
| Nepalese | 0.0 /100 | #299 | Tragic 88.1% |
| Immigrants | Guyana | 0.0 /100 | #300 | Tragic 88.1% |
| Immigrants | Cambodia | 0.0 /100 | #301 | Tragic 88.1% |
| Ecuadorians | 0.0 /100 | #302 | Tragic 88.0% |
| Immigrants | Bangladesh | 0.0 /100 | #303 | Tragic 88.0% |
| Vietnamese | 0.0 /100 | #304 | Tragic 87.9% |
| Immigrants | Dominica | 0.0 /100 | #305 | Tragic 87.7% |
| Natives/Alaskans | 0.0 /100 | #306 | Tragic 87.7% |
| Immigrants | Portugal | 0.0 /100 | #307 | Tragic 87.6% |
| Yup'ik | 0.0 /100 | #308 | Tragic 87.6% |
| Immigrants | Armenia | 0.0 /100 | #309 | Tragic 87.6% |
Demographics Similar to Costa Ricans by 12th Grade, No Diploma
In terms of 12th grade, no diploma, the demographic groups most similar to Costa Ricans are Somali (90.6%, a difference of 0.030%), Immigrants from Africa (90.5%, a difference of 0.030%), Portuguese (90.6%, a difference of 0.040%), South American Indian (90.6%, a difference of 0.050%), and Immigrants from Micronesia (90.6%, a difference of 0.060%).
| Demographics | Rating | Rank | 12th Grade, No Diploma |
| Immigrants | Bolivia | 12.3 /100 | #206 | Poor 90.6% |
| Armenians | 11.6 /100 | #207 | Poor 90.6% |
| Immigrants | Micronesia | 11.0 /100 | #208 | Poor 90.6% |
| Immigrants | Afghanistan | 11.0 /100 | #209 | Poor 90.6% |
| South American Indians | 10.9 /100 | #210 | Poor 90.6% |
| Portuguese | 10.6 /100 | #211 | Poor 90.6% |
| Somalis | 10.2 /100 | #212 | Poor 90.6% |
| Costa Ricans | 9.4 /100 | #213 | Tragic 90.5% |
| Immigrants | Africa | 8.5 /100 | #214 | Tragic 90.5% |
| Arapaho | 7.7 /100 | #215 | Tragic 90.5% |
| Shoshone | 7.5 /100 | #216 | Tragic 90.5% |
| Cherokee | 7.4 /100 | #217 | Tragic 90.5% |
| Immigrants | Cameroon | 7.4 /100 | #218 | Tragic 90.5% |
| Uruguayans | 7.0 /100 | #219 | Tragic 90.4% |
| Colombians | 6.6 /100 | #220 | Tragic 90.4% |