Eastern European vs Senegalese 12th Grade, No Diploma
COMPARE
Eastern European
Senegalese
12th Grade, No Diploma
12th Grade, No Diploma Comparison
Eastern Europeans
Senegalese
93.5%
12TH GRADE, NO DIPLOMA
100.0/ 100
METRIC RATING
12th/ 347
METRIC RANK
89.9%
12TH GRADE, NO DIPLOMA
1.1/ 100
METRIC RATING
249th/ 347
METRIC RANK
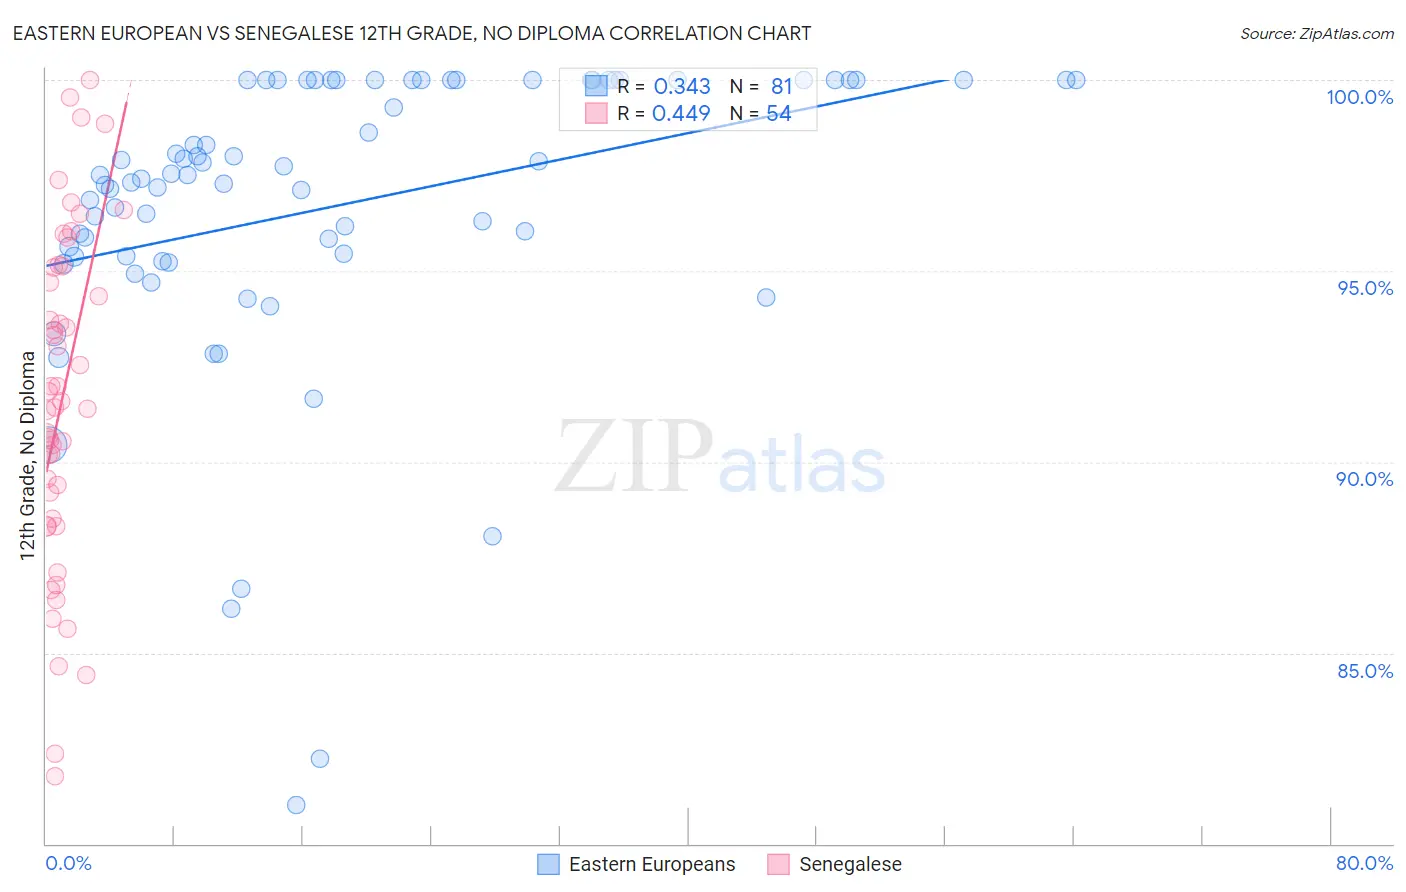
Eastern European vs Senegalese 12th Grade, No Diploma Correlation Chart
The statistical analysis conducted on geographies consisting of 461,247,615 people shows a mild positive correlation between the proportion of Eastern Europeans and percentage of population with at least 12th grade (no diploma) education in the United States with a correlation coefficient (R) of 0.343 and weighted average of 93.5%. Similarly, the statistical analysis conducted on geographies consisting of 78,142,569 people shows a moderate positive correlation between the proportion of Senegalese and percentage of population with at least 12th grade (no diploma) education in the United States with a correlation coefficient (R) of 0.449 and weighted average of 89.9%, a difference of 4.0%.
12th Grade, No Diploma Correlation Summary
| Measurement | Eastern European | Senegalese |
| Minimum | 81.0% | 81.8% |
| Maximum | 100.0% | 100.0% |
| Range | 19.0% | 18.2% |
| Mean | 96.7% | 91.6% |
| Median | 97.5% | 91.5% |
| Interquartile 25% (IQ1) | 95.4% | 88.5% |
| Interquartile 75% (IQ3) | 100.0% | 95.1% |
| Interquartile Range (IQR) | 4.6% | 6.6% |
| Standard Deviation (Sample) | 3.9% | 4.3% |
| Standard Deviation (Population) | 3.9% | 4.3% |
Similar Demographics by 12th Grade, No Diploma
Demographics Similar to Eastern Europeans by 12th Grade, No Diploma
In terms of 12th grade, no diploma, the demographic groups most similar to Eastern Europeans are Polish (93.5%, a difference of 0.010%), Danish (93.5%, a difference of 0.020%), Bulgarian (93.5%, a difference of 0.040%), Croatian (93.5%, a difference of 0.060%), and Latvian (93.6%, a difference of 0.090%).
| Demographics | Rating | Rank | 12th Grade, No Diploma |
| Carpatho Rusyns | 100.0 /100 | #5 | Exceptional 93.6% |
| Immigrants | India | 100.0 /100 | #6 | Exceptional 93.6% |
| Slovaks | 100.0 /100 | #7 | Exceptional 93.6% |
| Chinese | 100.0 /100 | #8 | Exceptional 93.6% |
| Latvians | 100.0 /100 | #9 | Exceptional 93.6% |
| Croatians | 100.0 /100 | #10 | Exceptional 93.5% |
| Poles | 100.0 /100 | #11 | Exceptional 93.5% |
| Eastern Europeans | 100.0 /100 | #12 | Exceptional 93.5% |
| Danes | 100.0 /100 | #13 | Exceptional 93.5% |
| Bulgarians | 100.0 /100 | #14 | Exceptional 93.5% |
| Finns | 100.0 /100 | #15 | Exceptional 93.4% |
| Maltese | 100.0 /100 | #16 | Exceptional 93.3% |
| Luxembourgers | 100.0 /100 | #17 | Exceptional 93.3% |
| Immigrants | Singapore | 99.9 /100 | #18 | Exceptional 93.3% |
| Germans | 99.9 /100 | #19 | Exceptional 93.3% |
Demographics Similar to Senegalese by 12th Grade, No Diploma
In terms of 12th grade, no diploma, the demographic groups most similar to Senegalese are Comanche (89.9%, a difference of 0.0%), Immigrants from Eritrea (89.9%, a difference of 0.030%), Spanish American (89.9%, a difference of 0.040%), Bahamian (89.9%, a difference of 0.050%), and Immigrants from Nigeria (89.9%, a difference of 0.060%).
| Demographics | Rating | Rank | 12th Grade, No Diploma |
| Immigrants | Costa Rica | 1.6 /100 | #242 | Tragic 90.0% |
| Crow | 1.5 /100 | #243 | Tragic 90.0% |
| Taiwanese | 1.5 /100 | #244 | Tragic 90.0% |
| Immigrants | Uruguay | 1.4 /100 | #245 | Tragic 90.0% |
| Ghanaians | 1.3 /100 | #246 | Tragic 90.0% |
| Immigrants | Nigeria | 1.3 /100 | #247 | Tragic 89.9% |
| Comanche | 1.1 /100 | #248 | Tragic 89.9% |
| Senegalese | 1.1 /100 | #249 | Tragic 89.9% |
| Immigrants | Eritrea | 1.0 /100 | #250 | Tragic 89.9% |
| Spanish Americans | 0.9 /100 | #251 | Tragic 89.9% |
| Bahamians | 0.9 /100 | #252 | Tragic 89.9% |
| Choctaw | 0.7 /100 | #253 | Tragic 89.8% |
| Immigrants | Peru | 0.5 /100 | #254 | Tragic 89.7% |
| Immigrants | Senegal | 0.5 /100 | #255 | Tragic 89.7% |
| Immigrants | Ghana | 0.5 /100 | #256 | Tragic 89.7% |