Eastern European vs Immigrants from Armenia 6th Grade
COMPARE
Eastern European
Immigrants from Armenia
6th Grade
6th Grade Comparison
Eastern Europeans
Immigrants from Armenia
97.9%
6TH GRADE
99.9/ 100
METRIC RATING
41st/ 347
METRIC RANK
94.9%
6TH GRADE
0.0/ 100
METRIC RATING
331st/ 347
METRIC RANK
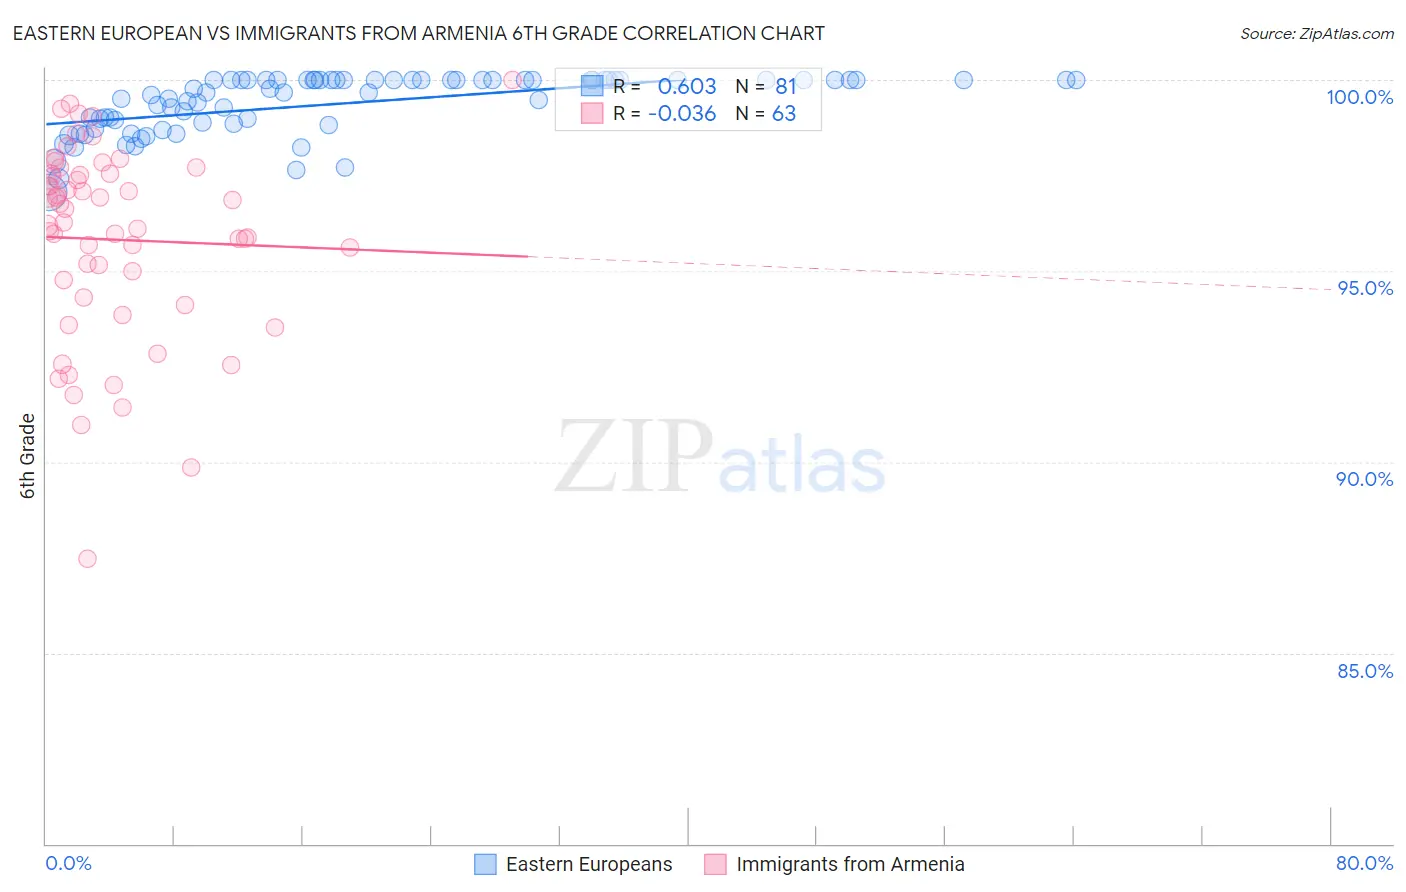
Eastern European vs Immigrants from Armenia 6th Grade Correlation Chart
The statistical analysis conducted on geographies consisting of 461,244,590 people shows a significant positive correlation between the proportion of Eastern Europeans and percentage of population with at least 6th grade education in the United States with a correlation coefficient (R) of 0.603 and weighted average of 97.9%. Similarly, the statistical analysis conducted on geographies consisting of 97,724,626 people shows no correlation between the proportion of Immigrants from Armenia and percentage of population with at least 6th grade education in the United States with a correlation coefficient (R) of -0.036 and weighted average of 94.9%, a difference of 3.2%.
6th Grade Correlation Summary
| Measurement | Eastern European | Immigrants from Armenia |
| Minimum | 97.1% | 87.5% |
| Maximum | 100.0% | 100.0% |
| Range | 2.9% | 12.5% |
| Mean | 99.4% | 95.8% |
| Median | 99.7% | 96.3% |
| Interquartile 25% (IQ1) | 98.8% | 94.3% |
| Interquartile 75% (IQ3) | 100.0% | 97.5% |
| Interquartile Range (IQR) | 1.2% | 3.2% |
| Standard Deviation (Sample) | 0.76% | 2.5% |
| Standard Deviation (Population) | 0.75% | 2.5% |
Similar Demographics by 6th Grade
Demographics Similar to Eastern Europeans by 6th Grade
In terms of 6th grade, the demographic groups most similar to Eastern Europeans are Hungarian (97.8%, a difference of 0.010%), Northern European (97.8%, a difference of 0.020%), Latvian (97.9%, a difference of 0.030%), Belgian (97.9%, a difference of 0.040%), and Luxembourger (97.9%, a difference of 0.040%).
| Demographics | Rating | Rank | 6th Grade |
| Swiss | 100.0 /100 | #34 | Exceptional 97.9% |
| Chinese | 100.0 /100 | #35 | Exceptional 97.9% |
| Italians | 100.0 /100 | #36 | Exceptional 97.9% |
| British | 100.0 /100 | #37 | Exceptional 97.9% |
| Belgians | 100.0 /100 | #38 | Exceptional 97.9% |
| Luxembourgers | 99.9 /100 | #39 | Exceptional 97.9% |
| Latvians | 99.9 /100 | #40 | Exceptional 97.9% |
| Eastern Europeans | 99.9 /100 | #41 | Exceptional 97.9% |
| Hungarians | 99.9 /100 | #42 | Exceptional 97.8% |
| Northern Europeans | 99.9 /100 | #43 | Exceptional 97.8% |
| Czechoslovakians | 99.9 /100 | #44 | Exceptional 97.8% |
| Bulgarians | 99.9 /100 | #45 | Exceptional 97.8% |
| Arapaho | 99.9 /100 | #46 | Exceptional 97.8% |
| Native Hawaiians | 99.9 /100 | #47 | Exceptional 97.8% |
| Celtics | 99.9 /100 | #48 | Exceptional 97.8% |
Demographics Similar to Immigrants from Armenia by 6th Grade
In terms of 6th grade, the demographic groups most similar to Immigrants from Armenia are Nepalese (94.9%, a difference of 0.010%), Dominican (94.9%, a difference of 0.080%), Immigrants from Honduras (94.8%, a difference of 0.10%), Honduran (95.0%, a difference of 0.15%), and Mexican American Indian (95.0%, a difference of 0.16%).
| Demographics | Rating | Rank | 6th Grade |
| Cape Verdeans | 0.0 /100 | #324 | Tragic 95.1% |
| Immigrants | Nicaragua | 0.0 /100 | #325 | Tragic 95.1% |
| Hispanics or Latinos | 0.0 /100 | #326 | Tragic 95.0% |
| Mexican American Indians | 0.0 /100 | #327 | Tragic 95.0% |
| Hondurans | 0.0 /100 | #328 | Tragic 95.0% |
| Dominicans | 0.0 /100 | #329 | Tragic 94.9% |
| Nepalese | 0.0 /100 | #330 | Tragic 94.9% |
| Immigrants | Armenia | 0.0 /100 | #331 | Tragic 94.9% |
| Immigrants | Honduras | 0.0 /100 | #332 | Tragic 94.8% |
| Immigrants | Latin America | 0.0 /100 | #333 | Tragic 94.7% |
| Immigrants | Azores | 0.0 /100 | #334 | Tragic 94.7% |
| Mexicans | 0.0 /100 | #335 | Tragic 94.6% |
| Immigrants | Dominican Republic | 0.0 /100 | #336 | Tragic 94.6% |
| Central Americans | 0.0 /100 | #337 | Tragic 94.5% |
| Immigrants | Cabo Verde | 0.0 /100 | #338 | Tragic 94.4% |