Eastern European vs French Bachelor's Degree
COMPARE
Eastern European
French
Bachelor's Degree
Bachelor's Degree Comparison
Eastern Europeans
French
47.5%
BACHELOR'S DEGREE
100.0/ 100
METRIC RATING
17th/ 347
METRIC RANK
36.5%
BACHELOR'S DEGREE
18.6/ 100
METRIC RATING
210th/ 347
METRIC RANK
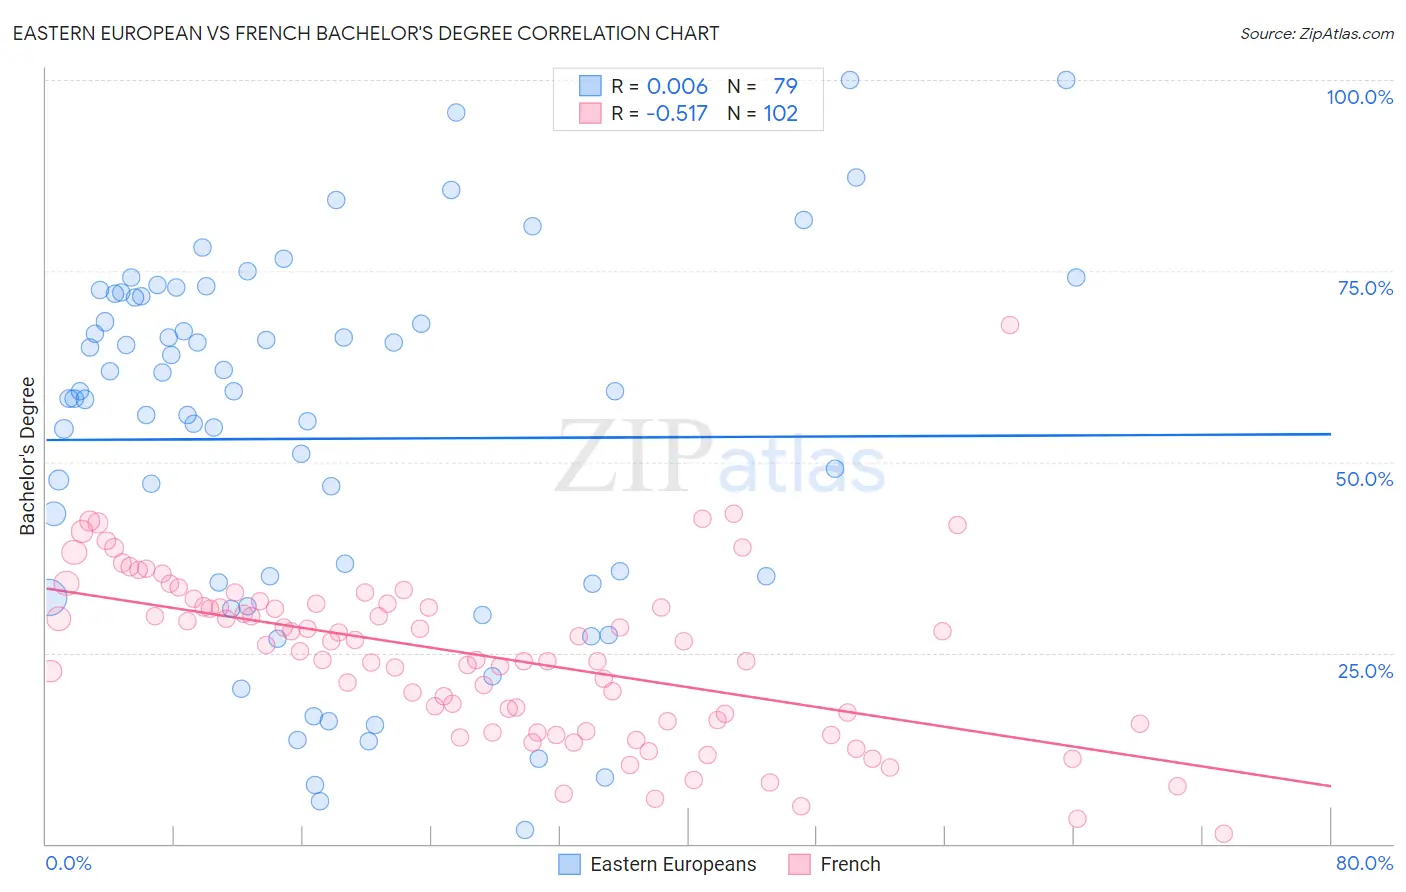
Eastern European vs French Bachelor's Degree Correlation Chart
The statistical analysis conducted on geographies consisting of 461,197,677 people shows no correlation between the proportion of Eastern Europeans and percentage of population with at least bachelor's degree education in the United States with a correlation coefficient (R) of 0.006 and weighted average of 47.5%. Similarly, the statistical analysis conducted on geographies consisting of 572,277,810 people shows a substantial negative correlation between the proportion of French and percentage of population with at least bachelor's degree education in the United States with a correlation coefficient (R) of -0.517 and weighted average of 36.5%, a difference of 30.3%.
Bachelor's Degree Correlation Summary
| Measurement | Eastern European | French |
| Minimum | 1.8% | 1.4% |
| Maximum | 100.0% | 68.0% |
| Range | 98.2% | 66.6% |
| Mean | 53.0% | 24.7% |
| Median | 58.3% | 25.6% |
| Interquartile 25% (IQ1) | 34.0% | 16.1% |
| Interquartile 75% (IQ3) | 71.7% | 31.4% |
| Interquartile Range (IQR) | 37.7% | 15.4% |
| Standard Deviation (Sample) | 24.1% | 11.0% |
| Standard Deviation (Population) | 23.9% | 10.9% |
Similar Demographics by Bachelor's Degree
Demographics Similar to Eastern Europeans by Bachelor's Degree
In terms of bachelor's degree, the demographic groups most similar to Eastern Europeans are Indian (Asian) (47.4%, a difference of 0.15%), Cambodian (47.2%, a difference of 0.58%), Immigrants from Switzerland (47.1%, a difference of 0.80%), Immigrants from Ireland (47.1%, a difference of 0.81%), and Soviet Union (47.9%, a difference of 0.86%).
| Demographics | Rating | Rank | Bachelor's Degree |
| Cypriots | 100.0 /100 | #10 | Exceptional 49.0% |
| Immigrants | Australia | 100.0 /100 | #11 | Exceptional 48.5% |
| Immigrants | China | 100.0 /100 | #12 | Exceptional 48.4% |
| Immigrants | South Central Asia | 100.0 /100 | #13 | Exceptional 48.3% |
| Immigrants | Hong Kong | 100.0 /100 | #14 | Exceptional 48.2% |
| Immigrants | Eastern Asia | 100.0 /100 | #15 | Exceptional 48.1% |
| Soviet Union | 100.0 /100 | #16 | Exceptional 47.9% |
| Eastern Europeans | 100.0 /100 | #17 | Exceptional 47.5% |
| Indians (Asian) | 100.0 /100 | #18 | Exceptional 47.4% |
| Cambodians | 100.0 /100 | #19 | Exceptional 47.2% |
| Immigrants | Switzerland | 100.0 /100 | #20 | Exceptional 47.1% |
| Immigrants | Ireland | 100.0 /100 | #21 | Exceptional 47.1% |
| Immigrants | Belgium | 100.0 /100 | #22 | Exceptional 47.0% |
| Immigrants | Sweden | 100.0 /100 | #23 | Exceptional 47.0% |
| Immigrants | Korea | 100.0 /100 | #24 | Exceptional 47.0% |
Demographics Similar to French by Bachelor's Degree
In terms of bachelor's degree, the demographic groups most similar to French are Panamanian (36.5%, a difference of 0.030%), Scotch-Irish (36.4%, a difference of 0.050%), Immigrants from Thailand (36.5%, a difference of 0.13%), Immigrants from Philippines (36.4%, a difference of 0.13%), and Immigrants from Middle Africa (36.6%, a difference of 0.32%).
| Demographics | Rating | Rank | Bachelor's Degree |
| Immigrants | Nigeria | 23.1 /100 | #203 | Fair 36.7% |
| Immigrants | Immigrants | 22.8 /100 | #204 | Fair 36.7% |
| Finns | 22.2 /100 | #205 | Fair 36.7% |
| Spaniards | 21.2 /100 | #206 | Fair 36.6% |
| Immigrants | Middle Africa | 20.6 /100 | #207 | Fair 36.6% |
| Immigrants | Thailand | 19.4 /100 | #208 | Poor 36.5% |
| Panamanians | 18.8 /100 | #209 | Poor 36.5% |
| French | 18.6 /100 | #210 | Poor 36.5% |
| Scotch-Irish | 18.3 /100 | #211 | Poor 36.4% |
| Immigrants | Philippines | 17.8 /100 | #212 | Poor 36.4% |
| Immigrants | Panama | 14.2 /100 | #213 | Poor 36.2% |
| Germans | 13.9 /100 | #214 | Poor 36.1% |
| Immigrants | Western Africa | 13.8 /100 | #215 | Poor 36.1% |
| Barbadians | 13.5 /100 | #216 | Poor 36.1% |
| German Russians | 10.2 /100 | #217 | Poor 35.8% |