Dutch West Indian vs Ecuadorian Professional Degree
COMPARE
Dutch West Indian
Ecuadorian
Professional Degree
Professional Degree Comparison
Dutch West Indians
Ecuadorians
3.1%
PROFESSIONAL DEGREE
0.0/ 100
METRIC RATING
327th/ 347
METRIC RANK
3.9%
PROFESSIONAL DEGREE
4.6/ 100
METRIC RATING
231st/ 347
METRIC RANK
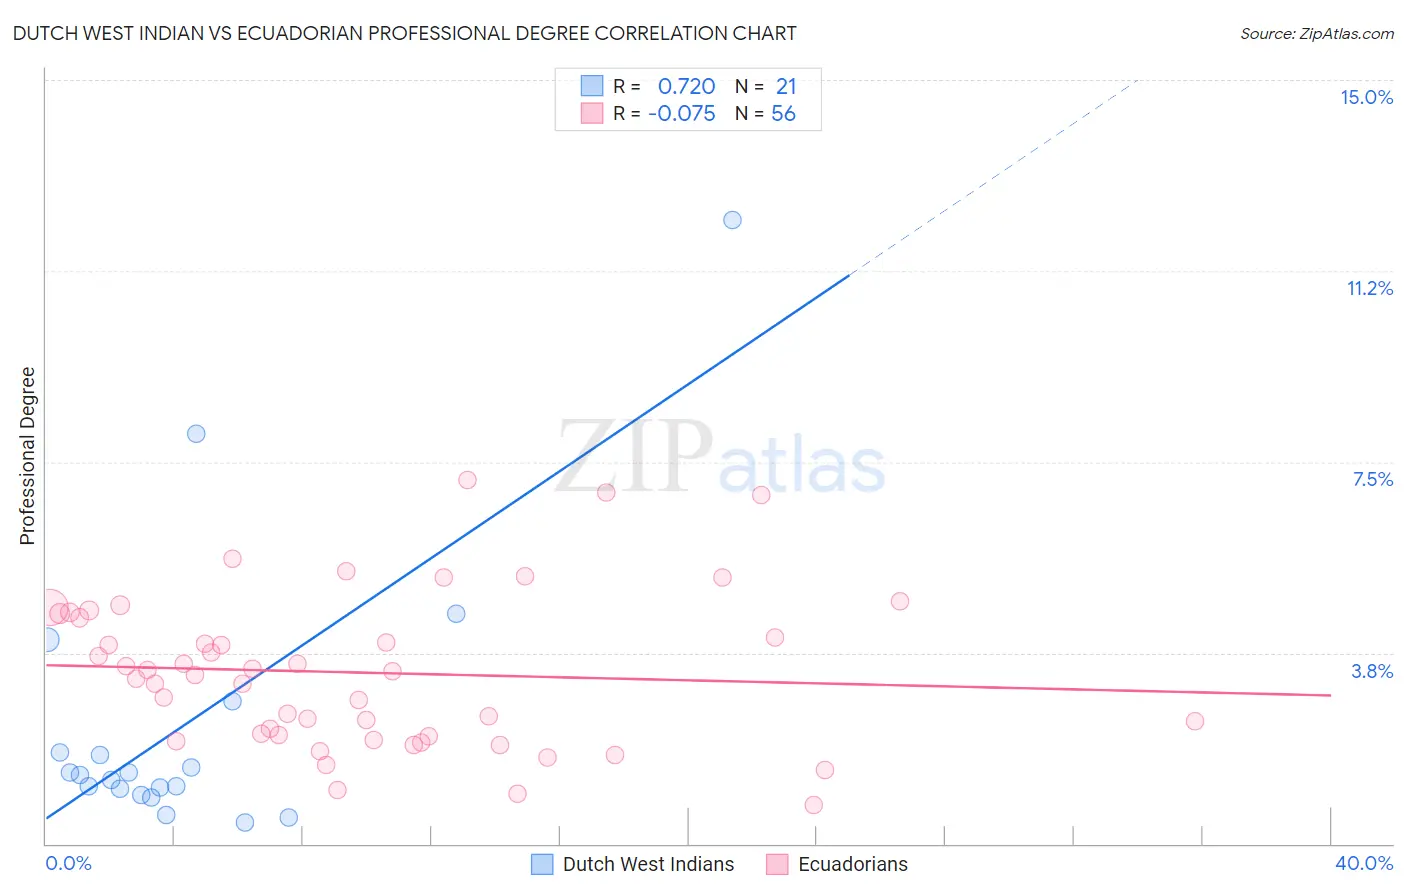
Dutch West Indian vs Ecuadorian Professional Degree Correlation Chart
The statistical analysis conducted on geographies consisting of 85,349,686 people shows a strong positive correlation between the proportion of Dutch West Indians and percentage of population with at least professional degree education in the United States with a correlation coefficient (R) of 0.720 and weighted average of 3.1%. Similarly, the statistical analysis conducted on geographies consisting of 317,407,214 people shows a slight negative correlation between the proportion of Ecuadorians and percentage of population with at least professional degree education in the United States with a correlation coefficient (R) of -0.075 and weighted average of 3.9%, a difference of 26.5%.
Professional Degree Correlation Summary
| Measurement | Dutch West Indian | Ecuadorian |
| Minimum | 0.42% | 0.77% |
| Maximum | 12.2% | 7.1% |
| Range | 11.8% | 6.4% |
| Mean | 2.4% | 3.4% |
| Median | 1.4% | 3.4% |
| Interquartile 25% (IQ1) | 1.0% | 2.1% |
| Interquartile 75% (IQ3) | 2.3% | 4.5% |
| Interquartile Range (IQR) | 1.3% | 2.4% |
| Standard Deviation (Sample) | 2.9% | 1.5% |
| Standard Deviation (Population) | 2.8% | 1.5% |
Similar Demographics by Professional Degree
Demographics Similar to Dutch West Indians by Professional Degree
In terms of professional degree, the demographic groups most similar to Dutch West Indians are Creek (3.1%, a difference of 0.060%), Menominee (3.1%, a difference of 0.10%), Bangladeshi (3.1%, a difference of 0.27%), Immigrants from Cabo Verde (3.1%, a difference of 0.35%), and Kiowa (3.1%, a difference of 0.47%).
| Demographics | Rating | Rank | Professional Degree |
| Seminole | 0.1 /100 | #320 | Tragic 3.2% |
| Tsimshian | 0.0 /100 | #321 | Tragic 3.2% |
| Hispanics or Latinos | 0.0 /100 | #322 | Tragic 3.2% |
| Inupiat | 0.0 /100 | #323 | Tragic 3.2% |
| Crow | 0.0 /100 | #324 | Tragic 3.2% |
| Yaqui | 0.0 /100 | #325 | Tragic 3.2% |
| Menominee | 0.0 /100 | #326 | Tragic 3.1% |
| Dutch West Indians | 0.0 /100 | #327 | Tragic 3.1% |
| Creek | 0.0 /100 | #328 | Tragic 3.1% |
| Bangladeshis | 0.0 /100 | #329 | Tragic 3.1% |
| Immigrants | Cabo Verde | 0.0 /100 | #330 | Tragic 3.1% |
| Kiowa | 0.0 /100 | #331 | Tragic 3.1% |
| Yakama | 0.0 /100 | #332 | Tragic 3.1% |
| Puget Sound Salish | 0.0 /100 | #333 | Tragic 3.1% |
| Pennsylvania Germans | 0.0 /100 | #334 | Tragic 3.0% |
Demographics Similar to Ecuadorians by Professional Degree
In terms of professional degree, the demographic groups most similar to Ecuadorians are Cree (3.9%, a difference of 0.21%), Nicaraguan (3.9%, a difference of 0.46%), Immigrants from Philippines (3.9%, a difference of 0.47%), Nonimmigrants (3.9%, a difference of 0.52%), and Immigrants from Barbados (3.9%, a difference of 0.53%).
| Demographics | Rating | Rank | Professional Degree |
| Trinidadians and Tobagonians | 7.1 /100 | #224 | Tragic 4.0% |
| Tlingit-Haida | 6.9 /100 | #225 | Tragic 4.0% |
| German Russians | 6.1 /100 | #226 | Tragic 4.0% |
| Cubans | 5.9 /100 | #227 | Tragic 4.0% |
| Immigrants | West Indies | 5.6 /100 | #228 | Tragic 4.0% |
| Immigrants | Burma/Myanmar | 5.4 /100 | #229 | Tragic 3.9% |
| Nicaraguans | 5.1 /100 | #230 | Tragic 3.9% |
| Ecuadorians | 4.6 /100 | #231 | Tragic 3.9% |
| Cree | 4.3 /100 | #232 | Tragic 3.9% |
| Immigrants | Philippines | 4.1 /100 | #233 | Tragic 3.9% |
| Immigrants | Nonimmigrants | 4.0 /100 | #234 | Tragic 3.9% |
| Immigrants | Barbados | 4.0 /100 | #235 | Tragic 3.9% |
| Spanish Americans | 3.8 /100 | #236 | Tragic 3.9% |
| Immigrants | Trinidad and Tobago | 3.8 /100 | #237 | Tragic 3.9% |
| Colville | 2.6 /100 | #238 | Tragic 3.8% |