Dutch West Indian vs Cherokee 1st Grade
COMPARE
Dutch West Indian
Cherokee
1st Grade
1st Grade Comparison
Dutch West Indians
Cherokee
98.0%
1ST GRADE
69.8/ 100
METRIC RATING
151st/ 347
METRIC RANK
98.3%
1ST GRADE
99.3/ 100
METRIC RATING
75th/ 347
METRIC RANK
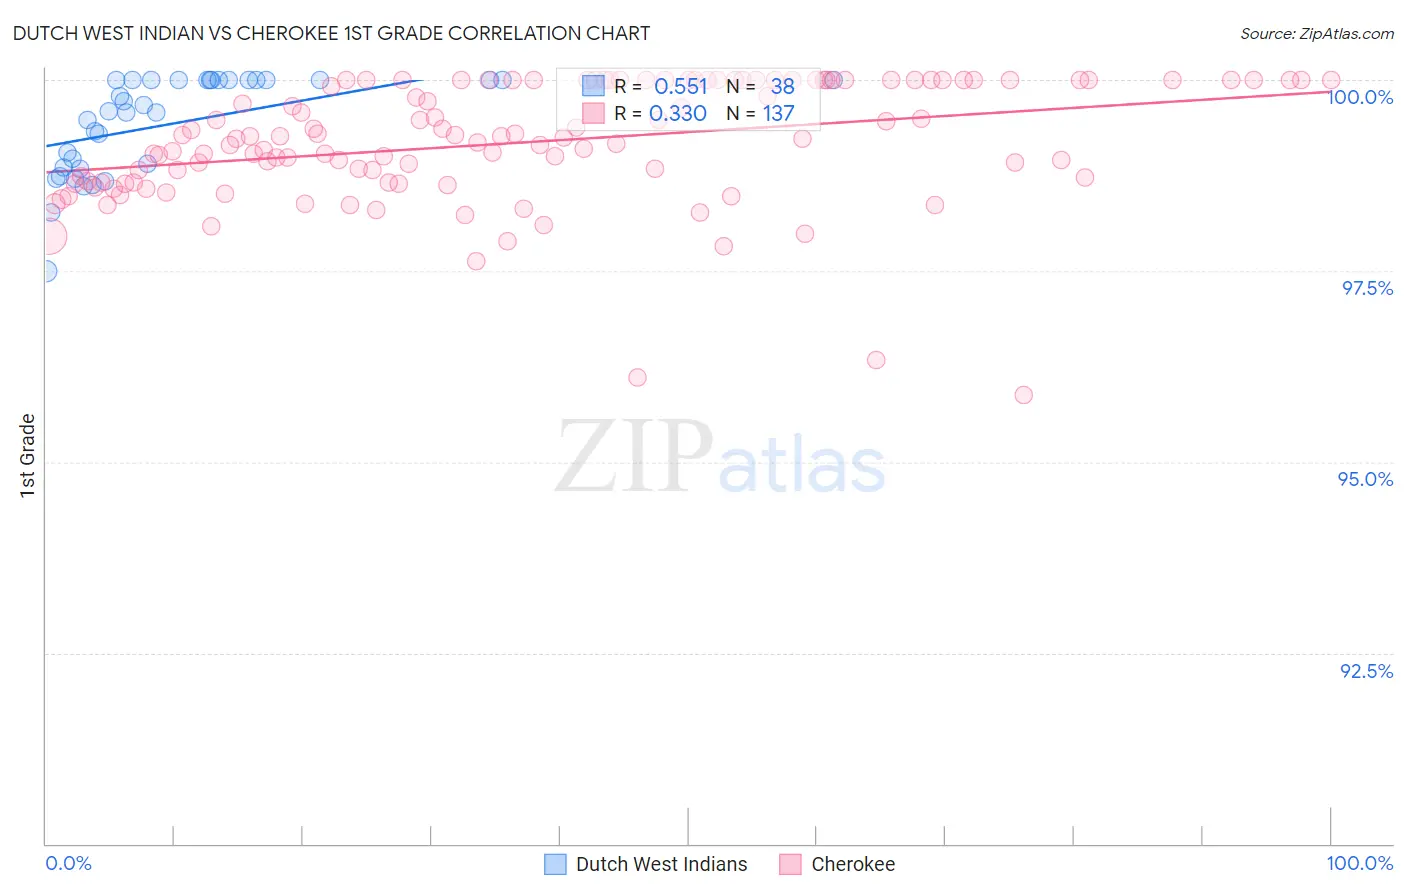
Dutch West Indian vs Cherokee 1st Grade Correlation Chart
The statistical analysis conducted on geographies consisting of 85,776,075 people shows a substantial positive correlation between the proportion of Dutch West Indians and percentage of population with at least 1st grade education in the United States with a correlation coefficient (R) of 0.551 and weighted average of 98.0%. Similarly, the statistical analysis conducted on geographies consisting of 493,719,253 people shows a mild positive correlation between the proportion of Cherokee and percentage of population with at least 1st grade education in the United States with a correlation coefficient (R) of 0.330 and weighted average of 98.3%, a difference of 0.32%.
1st Grade Correlation Summary
| Measurement | Dutch West Indian | Cherokee |
| Minimum | 97.5% | 95.9% |
| Maximum | 100.0% | 100.0% |
| Range | 2.5% | 4.1% |
| Mean | 99.4% | 99.2% |
| Median | 99.6% | 99.3% |
| Interquartile 25% (IQ1) | 98.9% | 98.7% |
| Interquartile 75% (IQ3) | 100.0% | 100.0% |
| Interquartile Range (IQR) | 1.1% | 1.3% |
| Standard Deviation (Sample) | 0.65% | 0.80% |
| Standard Deviation (Population) | 0.64% | 0.79% |
Similar Demographics by 1st Grade
Demographics Similar to Dutch West Indians by 1st Grade
In terms of 1st grade, the demographic groups most similar to Dutch West Indians are Immigrants from Moldova (98.0%, a difference of 0.0%), Soviet Union (98.0%, a difference of 0.0%), Jordanian (98.0%, a difference of 0.010%), Immigrants from Iran (98.0%, a difference of 0.010%), and Comanche (98.0%, a difference of 0.010%).
| Demographics | Rating | Rank | 1st Grade |
| Alsatians | 80.9 /100 | #144 | Excellent 98.0% |
| Hmong | 79.0 /100 | #145 | Good 98.0% |
| Immigrants | Israel | 77.8 /100 | #146 | Good 98.0% |
| Filipinos | 77.6 /100 | #147 | Good 98.0% |
| Apache | 75.2 /100 | #148 | Good 98.0% |
| Immigrants | Greece | 74.9 /100 | #149 | Good 98.0% |
| Jordanians | 72.7 /100 | #150 | Good 98.0% |
| Dutch West Indians | 69.8 /100 | #151 | Good 98.0% |
| Immigrants | Moldova | 69.5 /100 | #152 | Good 98.0% |
| Soviet Union | 68.9 /100 | #153 | Good 98.0% |
| Immigrants | Iran | 66.9 /100 | #154 | Good 98.0% |
| Comanche | 66.9 /100 | #155 | Good 98.0% |
| Immigrants | South Central Asia | 66.2 /100 | #156 | Good 98.0% |
| Immigrants | North Macedonia | 65.3 /100 | #157 | Good 98.0% |
| Venezuelans | 64.7 /100 | #158 | Good 98.0% |
Demographics Similar to Cherokee by 1st Grade
In terms of 1st grade, the demographic groups most similar to Cherokee are Immigrants from Netherlands (98.3%, a difference of 0.0%), Shoshone (98.3%, a difference of 0.0%), Immigrants from England (98.3%, a difference of 0.0%), Immigrants from Belgium (98.3%, a difference of 0.010%), and Cajun (98.3%, a difference of 0.020%).
| Demographics | Rating | Rank | 1st Grade |
| Immigrants | Northern Europe | 99.6 /100 | #68 | Exceptional 98.3% |
| Chickasaw | 99.6 /100 | #69 | Exceptional 98.3% |
| Russians | 99.6 /100 | #70 | Exceptional 98.3% |
| Serbians | 99.6 /100 | #71 | Exceptional 98.3% |
| Cheyenne | 99.6 /100 | #72 | Exceptional 98.3% |
| Cajuns | 99.5 /100 | #73 | Exceptional 98.3% |
| Immigrants | Netherlands | 99.4 /100 | #74 | Exceptional 98.3% |
| Cherokee | 99.3 /100 | #75 | Exceptional 98.3% |
| Shoshone | 99.3 /100 | #76 | Exceptional 98.3% |
| Immigrants | England | 99.3 /100 | #77 | Exceptional 98.3% |
| Immigrants | Belgium | 99.2 /100 | #78 | Exceptional 98.3% |
| Immigrants | Lithuania | 99.2 /100 | #79 | Exceptional 98.3% |
| Osage | 99.2 /100 | #80 | Exceptional 98.3% |
| Potawatomi | 99.1 /100 | #81 | Exceptional 98.3% |
| Icelanders | 99.1 /100 | #82 | Exceptional 98.3% |